
Impact of BMI, Alcohol, and Glucose Levels on ALT Variations in Non-Diabetic Subjects
This study examines the percentage changes in adjusted means of alanine aminotransferase (ALT) values across BMI deciles, alcohol consumption levels, and fasting plasma glucose categories. Linear trends were analyzed in subjects without a prior diagnosis of type 2 diabetes. Key trends include significant findings related to fasting plasma glucose and 2-hour plasma glucose after an oral glucose tolerance test (OGTT). The analysis highlights the influence of both traditional and novel risk factors on elevated ALT levels, providing insight into metabolic health.

Impact of BMI, Alcohol, and Glucose Levels on ALT Variations in Non-Diabetic Subjects
E N D
Presentation Transcript
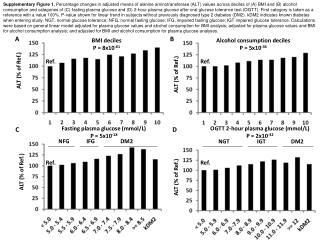
Supplementary Figure 1. Percentage changes in adjusted means of alanine aminotransferase (ALT) values across deciles of (A) BMI and (B) alcohol consumption and categories of (C) fasting plasma glucose and (D) 2-hour plasma glucose after oral glucose tolerance test (OGTT). First category is taken as a reference with a value 100%. P-value shown for linear trend in subjects without previously diagnosed type 2 diabetes (DM2). kDM2 indicates known diabetes when entering study. NGT, normal glucose tolerance; NFG, normal fasting glucose; IFG, impaired fasting glucose; IGT impaired glucose tolerance. Calculations were based on general linear model adjusted for plasma glucose values and alcohol consumption for BMI analysis; adjusted for plasma glucose values and BMI for alcohol consumption analysis; and adjusted for BMI and alcohol consumption for plasma glucose analyses. Fasting plasma glucose (mmol/L) P = 5x10-18 OGTT 2-hour plasma glucose (mmol/L) P = 2x10-32 NFG IFG DM2 NGT IGT DM2 A B Ref. Ref. ALT (% of Ref.) ALT (% of Ref.) C D BMI deciles P = 8x10-61 Alcohol consumption deciles P = 5x10-36 Ref. Ref. ALT (% of Ref.) ALT (% of Ref.)
Supplementary Figure 2. (A) Relative significance of different risk factors of serum alanine aminotransferase (ALT) levels demonstrated as number of subjects belonging to high risk groups. (B) Additional benefit of using novel markers (Matsuda insulin sensitivity index and serum interleukin 1 receptor antagonist levels (IL-1RA) on top of high BMI and alcohol consumption in the prediction of high ALT values. A 6447 men from a random population sample Cut-off points for the risk tertiles: Matsuda ISI < 26.03 BMI > 28.07 kg/m2 IL-1RA > 215.8 Alcohol > 120g/week 756 with ALT > 50 U/L 1) 518 (68%) with low Matsuda index 2) 455 (60%) with high BMI 3) 448 (59%) with high IL-1RA 4) 390 (52%) with IGT or DM2 (OGTT 2hr glucose) 5) 387 (52%) with high alcohol 6) 289 (38%) with IFG or DM2 (fasting glucose) B Identification of subjects with high ALT using conventional and novel risk factors Yes 602 (80%) No 154 (20%) High BMI or alcohol Yes 77 (10%) No 77 (10%) Low Matsuda index High IL-1RA Yes 25 (3%) No 52 (7%)
Supplementary Figure 3.Association of IL-1RA with ALT is independent of IL1RN and PNPLA3 genotypes. Associations of IL1RN rs315949 and PNPLA3 rs783409 with IL-1RA serum levels (A and D, respectively), serum ALT levels (B and E) and Matsuda insulin sensitivity index (ISI,C and F). Mean±SD. IL1RN: rs315949 PNPLA3: rs738409 A D p=2x10⁻⁵ p=0.172 Serum IL-1RA (pg/mL) Serum IL-1RA (pg/mL) B p=0.587 E p=5x10-11 ALT (U/L) ALT (U/L) C p=0.900 F p=0.968 Matsuda ISI Matsuda ISI