Download
1 / 44
460 likes | 563 Views
Weather Patterns & Forecasting. Pressure Systems. Weather- the conditions of the atmosphere at a certain place and time. Weather is often associated with pressure systems Air pressure is the weight of the molecules in the air. High Pressure Systems.

E N D
Pressure Systems Weather-the conditions of the atmosphere at a certain place and time. Weather is often associated with pressure systems Air pressure is the weight of the molecules in the air
High Pressure Systems • High-pressure system- a large body of circulating air that has high pressure at it’s center and lower pressure on the outside. • Occurs when air masses move apart. • High-pressure air at the center sinks and moves toward low pressure areas. • Brings clear skies and “nice” weather • Winds rotate clockwise around high pressure • Symbol:
Low Pressure Systems • Low pressure system- a large body of circulating air that has low pressure at it’s center and higher pressure on the outside. • Occurs when air masses come together. • Air in the center of the system rises, and the water vapor in it condenses and forms clouds. • Bring cloudy skies and showers • Winds rotate counter-clockwise around low pressure • Symbol:
Air Masses • Air masses- large bodies of air that have specific temperature and moisture characteristics. • forms when a high pressure system stays in one area for a few days. • Changes in weather are caused by the movement and interaction of air masses.
Air Masses • 4 kinds of Air masses: • Maritime (m)- originates over a body of water • Continental (c) -originates over land • Polar (P) -originates over a cold area • Tropical (T) -originates over a warm area • The characteristics of an air mass are determined by where it is formed.
Air Mass Combinations cP = continental polar = cool and dry cT = continental tropical = warm and dry mP = maritime polar = cool and wet mT = maritime tropical = warm and wet
WRITING RESPONSE If an air mass forms over land, what type of air mass is it? What words would you use to describe an air mass that formed over water near the equator?
WRITING RESPONSE If an air mass forms over land, what type of air mass is it? Air masses that form over land are called continental air masses How would you describe an air mass that formed over water near the equator? An air mass that formed over water and near the equator could be described as maritime tropical
Weather Fronts • A weather front is the boundary between two air masses. • They occur where air masses come together • 4 kinds of weather fronts: • Cold front • Warm front • Stationary front • Occluded front
Cold Fronts Cold air mass meets a warm air mass Pushes the warm air up, lifting the clouds Results in heavy rains or thunderstorms and cooler temperatures Symbol:
Warm Fronts Warm air mass meets a cold air mass Warm air rises above cold air and gradually replaces it Results in clear weather and warmer temperatures Symbol:
Cold & Warm Fronts Warm Front Cold Front
Stationary Fronts Cold air mass meets a warm air mass, but there is not enough force for the warm air to be lifted Results in days of cloudiness and constant rain Symbol:
Occluded Fronts Warm air mass gets caught above two cold air masses that converge Results in large amounts of rain and cooler temperatures Symbol:
Stationary & Occluded Fronts Occluded Front Stationary Front
WRITNG RESPONSE What type of front is being modeled in the diagram? Justify your answer
WRITNG RESPONSE What type of front is being modeled in the diagram? Justify your answer The front being modeled by the diagram is a Cold front because a cold air mass is moving toward a warm air mass.
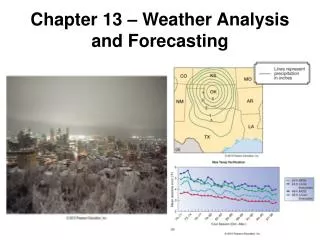
Weather Forecasting • Meteorology – the study of weather • Meteorologists( scientists who predict weather) measure weather variables before making a forecast. • A surface report describes a set of these weather measurements made on Earth’s surface. • These measurements include: • Temperature • Air pressure • Humidity • Precipitation • Wind speed and direction
Temperature Temperature is the measure of the average kinetic energy of molecules in the air. Molecules in warm air move faster than molecules in cooler air. Thermometersare used to measure temperature.
Air Pressure Air pressure is the measure of the force exerted by air molecules as they push down on objects—including you—with a force that we call the “barometric pressure.” Air pressure decreases as altitude increases. Barometers -respond to differences in air pressure
Humidity Humidity is the amount of water vapor in the air When air is saturated, it holds the maximum amount of water vapor possible at that temperature. Sling Psychrometers and Hygrometers are used to measure relative humidity.
Dew Point When air near the ground becomes saturated, the water vapor condenses into a liquid and forms dew. It the temperature is below 0C, ice crystals referred to as frost form. The temperature at which saturation occurs is called the DEW POINT.
Measuring Precipitation Rain is easy to measure—all you need is an “open tube with a ruler”—a RAIN GAUGE. “Tipping bucket” rain gauges can measure rainfall outside and connect to show a display inside.
Measuring Precipitation Measuring Snowfall- Measuring how much snow falls is trickier than measuring rain, because wind can carry it away or pile it up in drifts. Meter sticks or rulers in carefully selected locations are used to record how deep the snow lies. Meteorologists may also melt snow to find its “water equivalent”—what it would have been had it fallen as rain.
Wind Direction and Speed • When air moves—”wind”—we feel both its direction and speed (force.) • Wind direction is measured with a “vane”—an arrow or other shape that points into the wind. • Speed is measured with an anemometer. • The faster the cups spin, the faster the wind.
Weather Conditions above the Surface • An upper –air report describes wind, temperature, and humidity conditions above Earth’s surface. • Weather balloons with an attached instrument package called a radiosonde are released into the atmosphere to measure weather conditions above the surface • Radiosondes contain: • Temperature sensor • Relative humidity sensor • Barometer • Radio transmitter • Battery • Parachute • String to attach to balloon
Weather Satellites & Radar • Weather satellites provide even larger views of weather systems • They provide weather information by measuring the radiation given off by Earth and by taking photographs. • Infrared Satellite images provide information about cloud temperature & height • Doppler radar- a special form of radar that can be used to detect precipitation and approximate wind speed.
This color-enhanced image shows a storm passing Des Moines, Iowa. Heavier precipitation is shown by yellows and greens. http://radar.weather.gov/radar/latest/DS.p19r0/si.kdmx.shtml
X Here is a satellite image for the same time. ”X” shows the area where the storm in the radar image was located
Weather Maps A station model displays many weather measurements for a specific location It appears on weather maps. The next set of slides will explain how to read one.
Temperature 75 Air temperature is shown in Fahrenheit degrees by the number to the upper left of the circle.
Pressure 194 • Pressure—measured in mb (millibars)—is given by the number to the upper right of the circle • For example, suppose it’s 1019.4 mb • Only the 10s/1s/0.1s are shown—so it is represented as 194 • Pressures below 1000 mb would start with high numbers, such as 964 for 996.4 mb
Dew Point Temperature 57 The dew point temperature in Fahrenheit degrees is shown to the lower left of the circle.
Wind Direction and Speed Wind direction is show by an “arrow” going into the circle. The example shows wind blowing from the lower right, so this is a southeast wind. Each long “feather” represents 10 mph and each short “feather 5, so the wind speed is 25 mph.
Cloud Cover The amount of the circle that is filled in indicates how much of the sky is covered by clouds. It may range from “clear” (left) to “overcast” (right).
about 60% no clouds about 75% about 10% about 80% about 25% completely overcast about 40% sky obscured about 50%
Present Weather thunderstorm When rain, snow, or other forms of precipitation, lightning, and special weather conditions exist, these are shown by symbols to the left of the circle between air temperature and dew point temperature
Samples of present weather symbols. rain fog * snow haze slight rain showers , thunderstorm drizzle . ice or snow pellets lightning
Try to interpret this station model 1. Temperature: 45 o F 2. Pressure: 1004.5 mb 3. Dew Point: 29 o F 4. Clouds: overcast 5. Wind: from southeast at 15 mph 6. Precipitation: light rain 2 1 6 4 3 5
Weather maps have isobars which are symbols made up of lines that connect places that have equal air pressure.
Isotherms – are lines that connect places that have the same temperature.
Predicting The Weather Modern weather forecasts are made with the help of computers. Computer Models are detailed computer programs that solve a set of complex mathematical formulas. The formulas predict temperature, winds, precipitation, and types of clouds.