Download
1 / 21
210 likes | 303 Views
1. SSTs for 2005 2. Daily SST OI. Richard W. Reynolds (NOAA, NCDC). NOAA’s National Climatic Data Center Asheville, NC. OAA Climate Observation Program 4th Annual System Review Silver Spring, Maryland | May 10-12, 2006. SST Anomalies. Top: 2004 Anomaly Bottom: 2005 Anomaly

E N D
1. SSTs for 20052. Daily SST OI Richard W. Reynolds (NOAA, NCDC) NOAA’s National Climatic Data Center Asheville, NC OAA Climate Observation Program 4th Annual System Review Silver Spring, Maryland | May 10-12, 2006
SST Anomalies • Top: 2004 Anomaly • Bottom: 2005 Anomaly • Base Period: 1971-2000 • Differences • Slight change in weak ENSO • Shift in Tropical North Atlantic positive anomalies • Similarities • Northern high latitude positive anomalies ~ 60°N 2
Zonal SST Anomalies • Period: Jan '97 - Apr '06 • 1997-98 El Niño • Peak Jan 1998 • Strong northern high latitude positive SST anomalies in Boreal Summers: '03 - '05 • Peak anomaly similar to ENSO but surface area smaller • '05 less intense than '03 and '04 • Persistent modest northern middle latitude positive SST anomalies for record NOTE: Time 3
Zonal SST Anomalies • Period: Jan '82 - Apr '06 • 1982-83, 1987-88, 1997-98, major El Niño events • Northern high latitude positive SST anomalies • not evident before ~ 1997 • Persistent northern middle latitude positive SST anomalies • not evident before ~ 1998 • Clear evidence of warming trend with time between 20°S and 80°N NOTE: Time 4
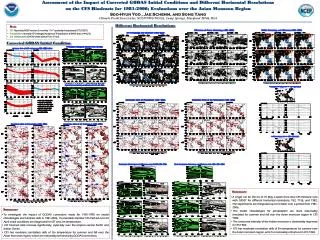
Left: July - Sept '04 • Right: July - Sept '05 • Anomalies shaded • Isotherms: 26-28ºC • SSTs needed for hurricane formation: roughly > 26.5ºC • Areas above 28ºC larger in 2005 than 2004 • Warmer anomalies tend to lie in these areas in 2005 Monthly SST NOTE: 5
2. Daily SST OI Richard W. Reynolds (NOAA, NCDC) Thomas M. Smith (NOAA, NCDC) Kenneth S. Casey (NOAA, NODC) Dudley Chelton (Oregon State University) NOAA’s National Climatic Data Center Asheville, NC OAA Climate Observation Program 4th Annual System Review Silver Spring, Maryland | May 10-12, 2006
Jan '03: Number of Days with Nighttime Obson 0.25° grid • Top: AVHRR Pathfinder Bottom: AMSR-E • For AVHRR: • Absolute latitudes > 40° have roughly only 5 days of data • Number of days increases toward the tropics • Drop offs due to cloud cover • For AMSR: • Absolute latitudes > 40° have more than 20 days of data • Drop offs due to precipitation in ITCZ and SPCZ 7
Magnitude of Gradient:Gulf Stream • Daily OI using AMSR-E for January - March 2003 • Gradients have a stationary part due to topography • Thus, limited AVHRR data are useful
Jan 2003: Standard Deviation Top: Pathfinder Bottom: AMSR-E • AMSR-E has stronger standard deviations than Pathfinder • Especially in mid-latitude winter • Clouds reduce Pathfinder sampling • These differences plus gradient differences suggest that separate Pathfinder OI and Pathfinder + AMSR OI needed 10
90N Nighttime Zonal Bias: AVHRR - In Situ AVHRR Pathfinder - In Situ 90S '82 '05 90N AVHRR Operational - In Situ 90S Pathfinder Advantages: Lower bias variability; data delayed Operational Advantages: Real-time data; 1981-84 data
Weekly & Daily OIDecember 1991 • Both OIs have bias correction for AVHRR data • Daily OI uses Pathfinder • Weekly OI uses Operational • From the figure note: • Operational data problem along 35oS • Delayed mode processing allows data correction • Daily scales reduced in high gradient areas 12
Weekly & Daily OIJanuary 1998 • Both OIs have bias correction for AVHRR data • Daily OI uses Pathfinder • Weekly OI uses Operational • From the figure note: • Pathfinder problem near equator in Eastern Pacific • Zonal bias in Pathfinder worse than Operational • Number of AVHRR retrievals lower than normal due to ENSO cloud cover 13
OI Anomalies with Bias CorrectionJanuary 1988: Along equator • From the figure note: • Operational AVHRR did not have strong biases in this region • Negative biases in daily OI except at TAO mooring sites near: 155oW, 140oW & 125oW • OI bias correction fails to correct AVHRR Pathfinder satellite biases
OI Anomalies with Bias CorrectionJanuary 1988: Along equator • From the figure note: • Operational AVHRR did not have strong biases in this region • Negative biases in daily OI except at TAO mooring sites near: 155oW, 140oW & 125oW • OI bias correction fails to correct AVHRR Pathfinder satellite biases • Empirical Orthogonal Teleconnections (EOT) bias correction better at correcting biases Daily OI computed with EOT bias correction
Daily Bias Differences: 1 Jan '03 - 31 Dec '04 EOTs reduce biases; Some residuals remain
Daily OI: Ship Biases • Satellite Biases are corrected with respect to in situ data (ships & buoys) • Ships have larger random and bias errors than buoys • Ship observations using buckets tend to be biased cold due to evaporation • Ship observations using engine intake tend to be biased warm due to engine room heating • Ship metadata needs improvement • Try to correct ship bias using buoy data • Preliminary tests indicate EOT procedures over a 45-60 day time period would work
Ship-Buoy SST Zonal Biases Annual Ship - Buoy Bias '94 • EOT monthly ship & buoy analyses • Buoy SST obs increase with time • Significant buoy obs 1994 to present • Care required to first correct in situ biases than satellite biases • Easier to correct buoys with respect to ships than inverse • NOT IMPLEMENTED !! Time '05 60°S 60°N
Daily OI: Status • Daily OI analysis computed on 0.25° grid with and without satellite EOT bias correction • Using Pathfinder AVHRR from 4 Jan 1985 to 31 December 2005 • Using Operational AVHRR from 1 Jan 2006 to present • Using AMSR-E from 1 Jun 2002 to 31 Dec 2005 • Using Pathfinder AVHRR & AMSR-E from 1 Jun 2002 to 31 Dec 2005 • Future Plans • Add error estimate field to OI • Improve sea ice concentrations and generation of SSTs from sea ice • Put output files in NetCDF • Make OI operational
Daily OI SST AnomaliesEOT satellite bias correction Left: Pathfinder AVHRR OI Right: Pathfinder AVHRR + AMSR-E OI • 27 August: Katrina • Weak anomaly in Gulf in Path + AMSR-E • 28 August: Katrina • Strong anomaly in Path + AMSR-E • 29 August: Katrina • Strong anomaly in Path + AMSR-E • Modest anomaly in Path 20
Daily FTP OI Products Pathfinder Operational AVHRR Only Present Jan '85 Dec '05 Pathfinder Operational AVHRR + AMSR-E Jun '02 Dec '05 Present • AVHRR only • Pathfinder (Jan '85 - Dec '05) • Operational (Jan '06 - present) • AVHRR + AMSR-E • Pathfinder (Jun '02 - Dec '05) • Operational (Jan '06 - present) • AMSR-E (Jun '02 - present) • Test other data: TMI, ATSR, MODIS…