Analyzing Competing Risks Data: Addressing Missing Data and Cause Misclassification Challenges
This paper by Dr. Ronny Westerman explores the complexities of analyzing competing risks data, particularly in the context of missing or misclassified causes of failure. It examines limitations of failure models and the significance of accurately identifying causes of events in survival analysis. The paper discusses various methodologies, including multiple imputations and Bayesian methods, for handling masked cause data. Real-world examples, such as infant mortality and breast cancer staging, illustrate the implications of misclassification. The findings highlight the importance of precise cause attribution in epidemiological research.

Analyzing Competing Risks Data: Addressing Missing Data and Cause Misclassification Challenges
E N D
Presentation Transcript
Issues for analyzing competing-risks data with missing or misclassification in causes Dr. Ronny Westerman Institute of Medical SociologyandSocialMedicine Medical School & University Hospital July 27, 2012
Introduction Background Data and Methods Results Discussion Reference • Outline • Introduction/Background • Data • Methods • Discussion • Perspectives
Introduction Background Data and Methods Results Discussion Reference • Introduction • Limited Failure Models (Immortal) • CompetingRisks • MissingandMisclassificationofcauses (Maskedcauses)
Introduction Background Data and Methods Results Discussion Reference • Limited FailureModel (CureSurvival Models) • Examples: Infant Mortality • Curabilityofcanceranddecreasingmortalityrisksincediagnosisofcancer • None defectiveunitsare not expectedtofailfromrisk
Introduction Background Data and Methods Results Discussion Reference The CompetingRisk Problem: Eachsubjectbeingexposedtomanycompetingrisks, but onlyone will becausedthefailure Subject ist still right-censoredifit do not failwithinthefollow-upduration
Introduction Background Data and Methods Results Discussion Reference • CompetingRisks • Non-parametic, semi-parametricandfull-parametricmodels • Cause-spezifichazardfunction • Problem: Assumptionofindependencethroughcauseoftenviolated? • Failure Time for all risksareoperativelythe same, in thatcase, all risksbeingremovedexcepttheriskunderconsideration
Introduction Background Data and Methods Results Discussion Reference • MissclassificationandMissingofcauses • Causeofeventforsomeofunitsorindividuals not exactlyidentifiedorrecored • Partial masking: Causeisnarrowed down but not exactelyidentified • Reasonformissclassification: • documentationcontainingtheinformationneededforattributingthecauseoffailuremaybe not collected, orthecauseofdiseasesforsomepatientsmaybedifficulttodetermine
Introduction Background Data and Methods Results Discussion Reference • Difficultiesfordetermination: (aetiologicalproblems) • Example: Cardioembolicstroke (Leary andCaplan, 2008) • Cardioembolicstrokeoccurswhentheheartpumpsunwantedmaterialsintothebraincirculation, resulting in theocclusionof a brainbloodvesselanddamagetothebraintissue. • CS diagnosed in 3-8% strokepatients, but in variouscurrentstrokeregistries, approximately 10-20% patients with CS have not maximal symptomsattheonsetoftheirstrokeExclusion
Introduction Background Data and Methods Results Discussion Reference • Missclassification: • Example: BreastCancer • TNM Stagingvs . I-IV Staging • Stage migration: improveddetectionofillnessleadstomovementofpeoplefromthesetofhealthypeopletothesetofunhealthypeople • Will Rogers phenomen: „WhentheOkiesleft Oklahoma andmovedtoCalifornia, theyraised theaverageintelligencelevel in bothstates“
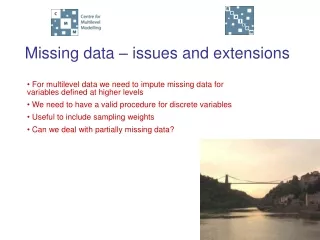
Introduction Background Data and Methods Results Discussion Reference • Methodsfortreatingmaskedcausedata • 1) MutipleImputations Shouldbeused, when Baseline are not proportional Works good in caseofMissingat Random (forcause) • Problem: High-Mortality-Risks, Multiple-Specificand High- Potential-Risksoften not Missingat Random Falseclassificationormisinterpretationofcause-specific mortality
Introduction Background Data and Methods Results Discussion Reference • Methodsfortreatingmaskedcausedata • 2) Second Stage Analysis • Models with non-proportional cause-specifichazard • 3) EM forgroupedSurvivaldata BayesianMethods • Assumptionsformaskedcauses: • Rightcensoring, ifcauses not exactlyidentified • Maskingprobabiltyisconstantover time
Introduction Background Data and Methods Results Discussion Reference • SEER CancerStatistic Data Base National Cancer Institute, DCCPS, Surveillance Research Program, Cancer Statistics Branch (released April 2012) • IncidencebyRace, Gender and Age (different periodsof time) • Cause-SpecificMortalityincluding all specificcancer • SEER public use dataset on survival of breast cancer patients from1992-2009 (n=69,990 in Situ)
Introduction Background Data and Methods Results Discussion Reference • LeadingCauseof Death in the U.S. 1975 vs. 2009 Source: US Moratlity Files, National Center ofHealthStatistics, Centers ofDiseaseControlandPrevention
Introduction Background Data and Methods Results Discussion Reference • US Death Rates, 1975-2009 Heart Disease compared to Neoplasms, by age at death Source: US Moratlity Files, National Center ofHealthStatistics, Centers ofDiseaseControlandPrevention Rates are per 100,000 and age-adjusted to the 2000 US Std Population (19 age groups - Census P25-1103).
Introduction Background Data and Methods Results Discussion Reference Source: US Moratlity Files, National Center ofHealthStatistics, Centers ofDiseaseControlandPrevention
Introduction Background Data and Methods Results Discussion Reference • 5-year Conditional Relative SurvivalforCanceroffemaleBreast SEER, 2012
Introduction Background Data and Methods Results Discussion Reference • Andnow, what‘stheproblem? PreliminaryAnalysis with SEER- DATA (Sen et al. 2010) • Over-sampling themaskedcases • 46 % ofthewomendiedduringfollow-up • Specificmortalityrelatedtobreastcancer, othercanceror non-cancerrelatedcauses • for 56 % theexactcauseofdeath was known • for 35 % partial informationavailable • 30 % withmissingcauseofdeath: falseclassification (breastcancertootheror multiples cancer) • 65 % missingcauseswerecompletymasked
Introduction Background Data and Methods Results Discussion Reference • How do deal withmaskedcauses ? • Motivation touseTwo-Component-Model formaskedcauses • Risksare latent: nospecificinformationaboutthecauseofthecomponentfailure • Onlysomeindividualsmaysusceptibletotheeventofinterest (curabilityortherecessiveriskforthedisease)
Introduction Background Data and Methods Results Discussion Referenc • Two-Component-Model formaskedcauses (Maller and Zhou, 1996) • First component: failureandsurvival time ofsusceptibleindividuals for a certainevent (in riskindividuals – IR) • Second component: failureandsurvivaltimesfor non-susceptible individuals (out ofriskindividuals –OR) • Population SurvivalFunction • Wecanuse STATA commandsforCureSurvival Models
Introduction Background Data and Methods Results Discussion Reference • Useful Statacommands for cure models: lncure, spsurv, and cureregr (Lambert, 2007) • the advances of cureregr: fits both mixture and nonmixture cure models parametric distributions: exponential, Weibull, lognormal, and gamma parametric distributions available • Optional:strsmix allowing more flexible parametric distributions
Introduction Background Data and Methods Results Discussion Reference Data Analysis with SEER Breast Cancer Data • Survival of breast cancer patients from 1992-2009 (n=69,990 in Situ) • causeofdeath: breastcancerandothercauses othercausesascompetingrisks • Weused a non-mixturecurefractionmodelwithWeibullandExponentialspecification
Introduction Background Data and Methods Results Discussion Reference Results from Data Analysis (Estimates for the Long-Term Survival Function) Λ-scaleparameter, φ- shapeparameter, p- long-term parameter
Introduction Background Data and Methods Results Discussion Reference • Results • noevidencethatWeibullprovides a betterfittingthantheExponential forSeerBreastCancer Data at 5% significance • corrobatetheempirical Kaplan-Meier Survival
Introduction Background Data and Methods Results Discussion Reference
Introduction Background Data and Methods Results Discussion Reference ThrillsandTearswithCureSurvival Models Thrills: lessassumptionsandminorcomputationproblems Tears: toovercomethenaïveassumptionfor infinite failure time of thenonsusceptipleunits
Introduction Background Data and Methods Results Discussion Reference Limitations for parametric hazard functions The complexity of the baseline hazard function (Crowther and Lambert, 2011) • beyond standard and sometimes biologically and implausibleshapes • a turning point in the hazardfunctionisobserved • 2-component mixturedistribution e.g. Weibull-Weibull-distribution otherdistributionfamilies also available
Introduction Background Data and Methods Results Discussion Reference • Options in STATA • STPM2: Statamoduletoestimate flexible parametricsurvivalmodels (Royston-Parmar models) (updatedby Lampert, 2012) • STPM2 also usedwith single- or multiple- record(moregeneralized) • STMIX: 2-component parametricmixturesurvivalmodels (Crowtherand Lambert, 2011) distributionchoicesincludes Weibull-Weibullor Weibull-exponential • STMIX canbeusedwith single- ormultiple-record
Introduction Background Data and Methods Results Discussion Reference • References • Craiuand Lee (2005): Model SelectionfortheCompeting-Risks Model withandwithoutmasking. Technometrics, Vol.25, No.4, 457-467 • Leary MC, Caplan LR (2008): Cardioembolicstroke: An updated on etiology, diagnosisandmanagement. Annuals Indian Academic Neurology , 11, 52-63 • Luand Liang (2008): Analysis ofcompetingrisksdatawithmissingcauseoffailureunder additive hazardmodel. Statistica Sinica 18, 219-234. • Crowtherand Lampert (2011): Simulatingcomplexsurvivaldata. Stata Nordic and Baltic Users‘ Group Meeting • National Cancer Institute DCCPS Surveillance Research Programme, Surveillance, Epidemiologyand End Results (SEER) Programme (www.cancer.seer.gov) Research Data (1973-2009) (Released April 2012) • Louzda et al. (2012): The Long-Term Bivariate Survival FGM Copula Model: An Application to a Brazilian HIV Data. Journal of Data Science 10, 515-535 • Roman et al. (2012): A New Long-Term Survival Distribution forCancer Data. Journal of Data Science 10, 242-258 • Sen et al. (2010): A Bayesianapproachtocompetingrisksanalysiswithmaskedcauseofdeath. Statistics in Medicine, 29, 1681-1695