Download
1 / 19
190 likes | 334 Views
Quantitative and Qualitative Prediction of Human Health Risks from Animal Antibiotics. Tony Cox and Douglas Popken Cox Associates Denver, Colorado www.cox-associates.com. Motivation: Uncertain Science. Does animal antibiotic use (AAU) really increase human treatment failures?

E N D
Quantitative and Qualitative Prediction of Human Health Risks from Animal Antibiotics Tony Cox and Douglas Popken Cox Associates Denver, Colorado www.cox-associates.com
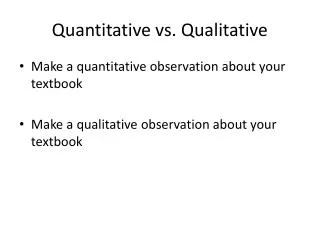
Motivation: Uncertain Science • Does animal antibiotic use (AAU) really increase human treatment failures? • Has it in the past? • Does it now? • Will it in the future? • How much, how soon, how probable? • Do human treatment failures really increase adverse clinical outcomes?
Proposed RM Principles • Precautionary: “When in doubt, go without!” • Not linked to causing desired outcomes • “Compound that may impact on human drug efficacy should be terminated” ; MAFF Bukai meeting 10-02 • Decision Analysis: “When in doubt, go find out”… and/or make your best bet now! • Good risk assessment informs good decisions • Value of information is based on changing decisions • Regulatory: When in doubt, make conservative guesses. Let evidence/judgment trigger actions. • Triggered action may do more harm than good
Trying to make things better can potentially make them worse… Enrofloxacin example: Risk model outputs
Q: How can this be? • A: Banning enrofloxacin increases the prevalence of airsacculitis… • Even assuming farmer’s try other drugs • Which increases the variance in bird sizes and weights at processing… • Which increases fecal contamination and variance/right tail of microbial load. • Data: Russell, 2003 • Which may increase human health risk • Lesson: System-wide view is crucial!
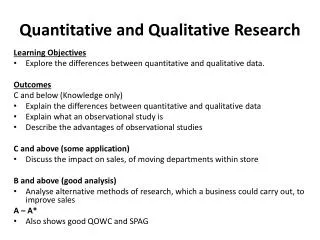
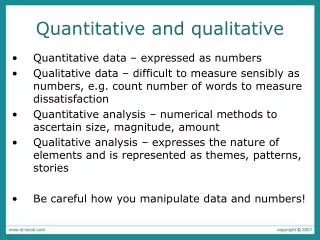
Using Risk Assessment (RA) to Improve RM Decisions The promise of quantitative risk assessment: • Science-based decisions, driven by facts and data. • Bridging gaps in the science and data: Assume vs. condition, bound, approximate, decompose… • RA lets science help achieve better (preferred) human health outcomes and make better bets • Can be more authoritative, participatory, open, and interpretable/less judgmental than “qualitative” RA • Tiered approach (qualitative/quantitative) often desirable • Quantitative risk assessment can be quicker, easier, cheaper, and more useful than qualitative!
Barriers to RA benefits • Lack of clarity on what to do and how to do it. • Q: Which methods/data are sound and useful? • A: Those that quantify and validate causal relations between decisions and their probable consequences that (should) drive evaluation and choice • Lack of willingness/resources to do needed work. • Is there a simpler way? • What is the least work needed for good answers? • Lack of credibility/value of results • Perceived or actual • Results too driven by uncertain assumptions (?)
Health Risk Analysis Basics Common-sense foundations: • A causal chain links risk management acts to their probable human health consequences: Decision/act Exposures Illnesses Consequences behaviors susceptibility treatment • Risk assessment quantifies the causal input-output relation for each link, pastes them together Good RA supports good RM • Risk management seeks acts/coordinating policies that make preferred consequences more likely.
Scoping a Risk Assessment • What acts are to be assessed? • Change drug use, HACCP, cooking, prescriptions… • What consequences matter? • Human infections, illnesses, durations, fatalities • Resistance in animals at slaughter and retail? • How about human health benefits from AAU? • What human subpopulations are to be considered? • What transmission paths are included? • Drugs, bugs, food products, preparation practices/venues • Time frames of consequences: Past, present, future • Static (consequences per year) vs. dynamic/transient
Avoid… • Risk estimates without decisions/goals/scope • Models without data • Attribution without proof/evidence • Attribution with epidemiological data • Causal conclusions without causal analysis • Recommendations based on data only • Situation-action triggers • Recommendations without decision analysis • Circular citations and popularity contests
Risk Assessment Steps • Scope the assessment • Decisions (e.g., AAU), strains (e.g., resistant and susceptible, bacteria), foods, populations, health effects • Validate causal chain (= hazard identification) • Use Exposure Illnesses Consequences • Estimate the links from data • Ratios (e.g., Illnesses / Exposure) • Conditional probabilities, e.g., Pr(illness | exposure) • Multiply ratios or compose link relations via Monte Carlo simulation. Pr(c | x) = xPr(c | r)Pr(r | x) • Sum estimates and uncertaintiesover paths, populations, impacts in scope to get total risk.
Guidance #152 • Basic idea:Risk is high (H) if release potential, exposure potential, or consequence (misinterpreted as “importance in human medicine”) are high. • Replace discussion of uncertain, perhaps disputed, facts with consensus-building on labels • Flexible, judgment-driven use of much information • Avoids need to estimate health consequences of acts • Limitations: • Labels (H, M, L) are ambiguous, not objective, may be difficult/expensive to build consensus on • Decisions informed by labels may not be good decisions
Rapid Risk Rating Technique (RRRT) • Goals: Fast, accurate, simple risk ratings and uncertainty analysis. Easy to carry out. • Use numbers instead of labels. • Focus on evaluating decisions instead of evaluating/labeling situations. • Compatible with full quantitative assessment. • Results are estimated human health impacts per year for different AAU decisions. • Changes in cases, illness-days, QALYs, fatalities
Goals of Rating What should an ideal qualitative rating system do? • Minimize expectederrors in qualitative rating (compared to true quantitative risk)? • Result: To minimize classification errors, ignore ratings from very uncertain estimates of factors. • Minimize expected cost of errors? • Reliable screening/identification of non-problems? • Maximize probability of picking worst problems? • Then why not pick them all? (Current #152 is close) • Maximize risk management productivity (value of problems addressed per unit time)? The new framework can do all of these.
RRRT Framework: Basics • “Rapid Risk Rating Technique” • Designed to be simple, correct, flexible/realistic • Work needed: estimating and documenting risk factors and uncertainty factors Basic idea: Estimate population risk as: Population Risk (e.g., illnesses/year) = ( use) * ( exposure/ use)*( illnesses/ exposure) * ( health impacts/ illness) • Adjust for multiple groups, outcomes, uncertainties
RRRT Key Data Elements • Use = fraction of animals treated • Exposure = contaminated servings ingested per year • Preventable fraction = fraction of exposure that would be prevented (or caused) by change in AAU • Not to be confused with “attributable risk” • Illnesses = campylobacteriosis, salmonellosis, etc. • Resistant vs. susceptible are distinguished • Impacts = illness-days by severity class (e.g., mild, moderate, severe, fatal), QALYs lost per year, etc. • Reflect treatment-seeking, prescription practices, outcome probabilities
RRRT Calculations • Calculate preventable illnesses per year from AAU • total illnesses per year * fraction from food * fraction of food-borne illnesses from specific commodity * fractional change in contaminated servings from AAU • Sum over all paths: resistant and susceptible bacteria, drugs and bacteria of direct and indirect (co-selected, cross-resistant, etc.) interest • Sum over years and populations of interest • Weight by consequences (illness-days, fatalities, QALYs lost, etc. by severity class) per illness • Result: Expected human health impacts/yr.
RRRT Lessons • Proof-of-concept applications: Streptogramins, macrolides, tetracyclines, fluoroquinolones • Lesson #1: Human health risks are often much smaller than might be expected (<< 0.1 case per year caused by AAU) • Lesson # 2: Potential net human health benefits from AAU may be significant (>> 100 cases prevented per year) when quantified • Lesson # 3: Key data need is relation between AAU and microbial loads in processed food