Download

1 / 9
90 likes | 265 Views
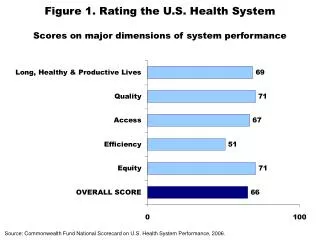
Figure 1. Rating the U.S. Health System Scores on major dimensions of system performance. Source: Commonwealth Fund National Scorecard on U.S. Health System Performance, 2006. 1. Figure 2. 47 Million People Were Uninsured in 2006, an Increase of 8.6 Million Since 2000.

E N D
Figure 1. Rating the U.S. Health SystemScores on major dimensions of system performance Source: Commonwealth Fund National Scorecard on U.S. Health System Performance, 2006. 1
Figure 2. 47 Million People Were Uninsured in 2006, an Increase of 8.6 Million Since 2000 Number of uninsured, in millions Note: 2000–2006 estimates reflect the results of follow-up verification questionsand implementation of Census 2000-based population controls. Source: U.S. Census Bureau, March Current Population Survey, 2000–2007.
1999–2000 2005–2006 NH ME WA NH VT ME WA VT ND MT ND MT MN MN OR NY MA WI OR MA NY ID SD WI RI MI ID SD RI WY MI CT PA WY NJ CT IA PA NJ NE IA OH DE IN NE OH NV DE IN IL MD NV WV UT VA IL MD CO DC WV UT VA KS MO KY CA CO DC KS MO KY CA NC NC TN TN OK SC AR OK AZ NM SC AR AZ NM MS GA AL MS GA AL TX LA TX LA FL FL AK AK 23% or more HI HI 19%–22.9% 14%–18.9% Less than 14% Figure 3. The Rate of Uninsured Nonelderly Adults Rose from 17 Percent to 20 Percent in Six Years Source: Commonwealth Fund State Scorecard on Health System Performance, 2007. Updated data: Two-year averages 1999–2000, updated with 2007 CPS correction, and 2005–2006 fromthe Census Bureau’s March 2000, 2001 and 2006, 2007 Current Population Surveys.
Figure 4. Cumulative Changes in AnnualNational Health Expenditures, 2000–2007 Percent 109% 91% 65% 24% Notes: Data on premium increases reflect the cost of health insurance premiums for a family of four/the average premium increase is weighted by covered workers. * 2006 and 2007 private insurance administration and personal health care spending growth rates are projections. Sources: A. Catlin, C. Cowan, S. Heffler et al., “National Health Spending in 2005: The Slowdown Continues,” Health Affairs, Jan./Feb. 2007 26(1):143–53; J. A. Poisal, C. Truffer, S. Smith et al., “Health Spending Projections Through 2016: Modest Changes Obscure Part D’s Impact,” Health Affairs Web Exclusive (Feb. 21, 2007):w242–w253; Henry J. Kaiser Family Foundation/Health Research and Educational Trust, Employer Health Benefits Annual Surveys, 2000–2007 (Washington, D.C.: KFF/HRET).
Figure 5. Growth in National Health Expenditures Under Various Scenarios National health expenditures (NHE), in trillions of dollars $4.14 T (19.6% GDP) Cumulative savings projections to 2016: One-time savings of 5%: $1.56 trillion Slowing trend by 1% annually: $1.72 trillion Combination of one-time savings and slowing trend: $3.19 trillion $3.93 T (18.6% GDP) $3.77 T (17.8% GDP) $3.58 T (16.9% GDP) $1.99 Tin 2005 Source: Authors’ analysis of data from J. A. Poisal, C. Truffer, S. Smith et al., “Health Spending Projections Through 2016:Modest Changes Obscure Part D’s Impact,” Health Affairs Web Exclusive (Feb. 21, 2007):w242–w253. 5
Figure 6. Nine of 10 Americans Support Well-Coordinated Care Percent 96 94 93 92 Source: Commonwealth Fund Survey of Public Views of the U.S. Health Care System, 2006.
Figure 7. Where Is the U.S. on Health IT?Only 28% of U.S. primary care physicians have electronic medical records (EMRs), and only 19% have advanced IT capacity Percent reporting seven or moreof 14 IT functions* Percent reporting EMR * The 14 functions are: EMR, EMR access other doctors, outside office, patient; routine use electronic ordering tests,prescriptions, access test results, access hospital records; computer for reminders, Rx alerts, prompt test results;easy to list diagnosis, medications, patients due for care. Source: Commonwealth Fund 2006 International Health Policy Survey of Primary Care Physicians.
Figure 8. Aiming Higher: The National Committeefor Quality Assurance ExperienceBeta-blocker treatment following heart attack Percent of patients Avg. score = 71 (1996) Avg. score = 97 (2005) Source: National Committee for Quality Assurance, The State of Health Care Quality 2006 (Washington, D.C.: NCQA, 2006);T. H. Lee, “Eulogy for a Quality Measure,” New England Journal of Medicine, Sept. 20, 2007 357(12):1175–77.
Figure 9. Health Policy Priorities for Congress,According to Health Care Opinion Leaders “How important do you think the following health care issues arefor Congress to address in the next five years?” Top 10 Issues: Percent responding “absolutely essential” or “very important” Note: Based on a list of 17 issues. Source: The Commonwealth Fund Health Care Opinion Leaders Survey, Jan. 2007.