Ice Jam Prediction
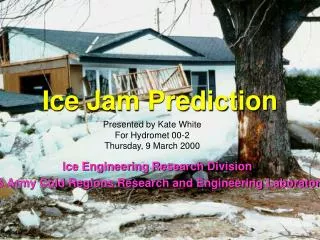
Ice Jam Prediction. Presented by Kate White For Hydromet 00-2 Thursday, 9 March 2000. Ice Engineering Research Division US Army Cold Regions Research and Engineering Laboratory. Why try to predict ice jams?. Improve emergency response Increase flood fighting effectiveness Hindcast

Ice Jam Prediction
E N D
Presentation Transcript
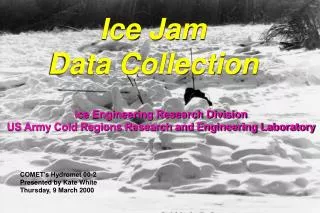
Ice Jam Prediction Presented by Kate White For Hydromet 00-2 Thursday, 9 March 2000 Ice Engineering Research Division US Army Cold Regions Research and Engineering Laboratory
Why try to predict ice jams? • Improve emergency response • Increase flood fighting effectiveness • Hindcast • Synthesize a historical record of jams for design or flood warning purposes
Ideal ice jam prediction model • Will provide a quantitative probability of ice jam occurrence or flooding with enough lead time to institute mitigation measures • Type I error (i.e., a jam occurs when it was not predicted) rate small • Type II error (“cry wolf”) rate small • Variables easily and accurately measured or forecast
Ice Jam Prediction Model The ideal: “generalized, site-transferable methods” which address all issues. The reality: A collection of site-specific methods, each of which addresses only those issues deemed important at that specific site. A wide variety of forecasting techniques are used.
No Ice Cover Stable or Ice Cover Insufficient Formation Ice to Form Jam Mechanical Breakup: Thermal Decay (ice pieces generated) Thermal Meltout Ice Run (ice melts in place) Transport Capacity Transport Capacity Exceeded not Exceeded No Jam No Jam Jam No Jam
Ice Jam Prediction Issues • Stable ice cover formation • Ice cover growth, strength, and decay • Mechanical vs. thermal breakup • Ice transport • Ice jam formation • Flood levels and rate of rise
Ice Cover Formation Strength and Decay Breakup Air temperature AFDD Discharge Other met data Air Temp TDD /Sunlight Ice thickness Snow cover Freezeup stage Rate of change in Q and/or stage Antecedent meteorological conditions Important Variables
Ice Transport Ice Jam Formation Flood Levels Discharge Floe size and strength River plan form River geometry and slope Discharge Ice volume Granular ice strength parameters Downstream stages Discharge Ice volume Important Variables
Modeling Considerations Easier Harder Many Historical Ice JamsFew Consistent Winter WeatherVariable One Spring PeakHydrologyMany peaks Long Duration of Ice Cover Short Comprehensive Data Available Little Moderate Ice Jam Severity Extreme
Frequent problems withice-related data • Short or interrupted period of record • Low frequency ice jams • Perception stage • Misclassifications • Reliability of measurements • Error in discharge estimation • Interrelationships among variables understood to varying degrees • Lack of observations
Types of jam prediction models • Probabilistic forecasting • Empirical threshold • Empirical cluster-type analysis • Multiple linear regression • Logistic regression • Discriminant function analysis • Deterministic • Other
Brief review of existing breakupjam prediction models • Use a wide variety of variables • Some focus on small part of process • Results variable • Few easily transported to other locations
Threshold identification • Goal is to identify one or more variables for which a threshold exists, or where statistically significant differences are present
AFDD’s Box & Whisker Plots Snow Depth
Threshold Models • White & Kay(Platte R., North Bend, NE) • AFDD > 400 • Q > 6000 cfs or Q>=.39(JD)1.9 • whichever is larger • Identified 65% of the ice events +-7 days • 41% wrong date or Type II error • One Type I error
Threshold Models • Tuthill et. al. (Winooski R., Montpelier, VT) • 1 Dec - 31 March • Q > 1,800 cfs • No peaks > 1,000 cfs in previous 30 days • Time to peak less than 3 days • Identified 13 of 17 known historic ice jams • Also identified 22 “potential” jams (I.e., large Type II error)
Threshold Models • White & Daly (Oil Creek, Oil City, PA) • 15AFDD > 120 • 1Q > 1,000 cfs Predicted Predicted Jam No Jam___ Actual Jam 19 2 21 Actual No Jam 35 6 41 54 8 62
Discriminant Function Analysis • White & Daly (Oil Creek, Oil City, PA) • LogARQ: Log Allegheny R Discharge • Log1QOC: Log 1 Day Oil Creek Q • 2AFDD: 2 Day AFDD Predicted Predicted Jam No Jam___ Actual Jam 11 6 17 Actual No Jam 1 33 34 12 39 51
Stable ice cover formation Ice cover strength and decay rate Mechanical breakup Ice transport Ice jam formation Flood levels 1-D hydraulic models with thermal & ice solar penetration models Onset of breakup Hydraulic models with ice: free drift;discrete parcel; discrete element Hydraulic model: unsteady vs. steady Deterministic Models
Deterministic Models • Uncertainties enter due to • parameters • input data • structural problems • Difficult to deal with uncertainty in any direct manner • Development lagging due to lack of compete analytical model
Summary • Ice jam formation is a very site specific phenomena • There are a number of issues inhibiting development of ice jam prediction models • The ideal of “generalized, site-transferable methods” remains a goal
A number of techniques have been used for forecasting jams Threshold models have been successfully used in some cases Deterministic models can achieve the goal of a generalized method, but a complete analytical model is required and the problems of uncertainty must be addressed
Partnerships between agencies will increase effectiveness of response to ice jams Examples: • NWS inclusion of ice jams in Hydromet training http://www.nws.noaa.gov/er/nerfc/riverice/Training00a/ • Corps-NWS partnerships (e.g., St. Paul District, NCRFC) • CRREL partnerships (e.g., MARFC, NERFC, NWS Glasgow MT)
http://www.nws.noaa.gov/er/nerfc/riverice/Part1/ http://www.nws.noaa.gov/er/nerfc/riverice/Part2/