Schematic Diagram of Amino Acid Biosynthesis Pathways and Feedback Regulation
This diagram illustrates the complex biosynthetic pathways for amino acids, highlighting the feedback regulation mechanisms involved. Different colors represent key pathways: pink for pyruvate, green for aspartate, blue for glutamate, yellow for 3-phosphoglycerate, and purple for phosphoenolpyruvate. Feedback inhibition is indicated by red dashed lines. Additionally, two groups of co-accumulated amino acids are marked, showcasing their significance based on SCC values. Notably, the contents of cysteine, asparagine, and glutamine were not analyzed in this study.
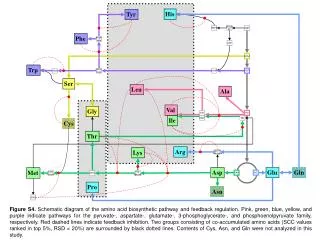

Schematic Diagram of Amino Acid Biosynthesis Pathways and Feedback Regulation
E N D
Presentation Transcript
His Tyr PRPP Ribose 5P G6P Phe aroge- nate E4P 3PGA Trp indole choris- mate DAHP PEP Ser Leu Ala Val Gly KIV PV Ile KMV KB Cys Thr Arg Lys arginino succinate Glu Gln Asp Met OAA KG cysta- thionine OPH Asp- semiald Pro Asn SAM Figure S4. Schematic diagram of the amino acid biosynthetic pathway and feedback regulation. Pink, green, blue, yellow, and purple indicate pathways for the pyruvate-, aspartate-, glutamate-, 3-phosphoglycerate-, and phosphoenolpyruvate family, respectively. Red dashed lines indicate feedback inhibition. Two groups consisting of co-accumulated amino acids (SCC values ranked in top 5%, RSD < 20%) are surrounded by black dotted lines. Contents of Cys, Asn, and Gln were not analyzed in this study.