Download
1 / 35
390 likes | 763 Views
CHAPTER 5 Risk and Rates of Return. 5.1 Rates of Return. Holding Period Return: Rates of Return over a given period

E N D
5.1 Rates of Return • Holding Period Return: Rates of Return over a given period • Suppose the price of a share is currently $100, and your time horizon is one year. You expect the cash dividend during the year to be $4. Your best guess about the price of the share is to be $110 after one year from now. So,
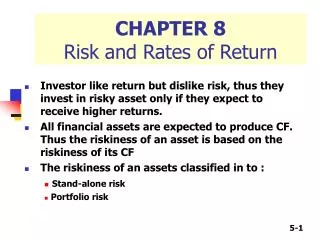
5.2 Risk and Return • Risk is the concept of fluctuations. This fluctuations can be (i) a deviation of the actual return from the expected return, or (ii) a deviation of average return from the year to year return. Higher the fluctuations, higher is the risk. Measures of risk are: • i. Standard Deviation • ii. Coefficient of Variance • iii. Beta
Calculation of Risk-Return: Scenario Analysis (Probability Distribution)
Figure:5.3:Normal DistributionA normal distribution looks like a bell-shaped curve. Probability Mean=13.25% Standard Deviation=8.87% + 3s39.86% – 3s– 13.36% – 2s– 4.5% – 1s4.4% 013.25% + 1s22.12% + 2s31% 68.26% 95.44% 99.74%
5.3 THE HISTORICAL RECORD Bills, Bonds, and Stocks:1926-2006
Figure 5.1 Frequency Distributions of Holding Period Returns
Firm X Firm Y Rate of Return (%) -70 0 15 100 Expected Rate of Return Probability distributions • With the same average return more standard deviation means more risk. Shown graphically. Note that as risk increases height goes down and width increases.
Optimum portfolio and CML: Given the feasible set highest possible utility function gives us O.P. and the tangency is CML . CML U1 O.P Borrowing Return Feasible set Lending Risk (σ)
Investor attitude towards risk • Risk aversion – assumes investors dislike risk and require higher rates of return to encourage them to hold riskier securities. • Risk premium – the difference between the return on a risky asset and less risky asset, which serves as compensation for investors to hold riskier securities.
Risk Premiums and Risk Aversion • If T-Bill denotes the risk-free rate, rf, and variance, , denotes volatility of returns then: The risk premium of a portfolio is: To quantify the degree of risk aversion with parameter A: If the risk premium of a portfolio is 8%, and the standard deviation is 20%, then risk aversion of the investor is: A=.08/(.5x.22)=4. Compare this with risk premium of 10%, and A=.1/(.5x.22)=5
Coefficient of Variation (CV) A standardized measure of dispersion about the expected value, that shows the risk per unit of return. When, both return and risk increase then coefficient of variance (CV) should be used.
Use of coefficient of variance • Example: We have 2 alternatives to invest. Security A has a mean return of 10% and a standard deviation of 6%, and security B has a mean return of 13% with a standard deviation of 8%. Which investment is better. So, security A is better as the Coefficient of variance of A is less than the that of B.
Real vs. Nominal Rates Fisher effect: Approximation Let, nominal rate=R Real rate=r Inflation rate (CPI)=i nominal rate = real rate + inflation rate: R ≈ r + i or r = R - i Example r = 3%, i = 6% R = 9% = 3% + 6% or 3% = 9% - 6% Fisher Effect: 2.83% = (9%-6%) / (1.06)
Risk tolerance: Slope of Indifference curves • Return Conservative Normal 15% 10% 7% 6% Aggressive Risk (σ)
Optimum portfolio with different risk tolerance Conservative • Return Aggressive Normal CML Efficient Frontier Rm Risk (σ) σm
Risk Aversion and Allocation • Greater levels of risk aversion lead to larger proportions of the risk free rate • Lower levels of risk aversion lead to larger proportions of the portfolio of risky assets • Willingness to accept high levels of risk for high levels of returns would result in leveraged combinations
Allocating Capital • Possible to split investment funds between safe and risky assets • Risk free asset: proxy; T-bills • Risky asset: stock (or a portfolio) • Issues • Examine risk/ return tradeoff • Demonstrate how different degrees of risk aversion will affect allocations between risky and risk free assets
The Risky Asset:Text Example (Page 149) Total portfolio value = $300,000 Risk-free value = 90,000 Risky (Vanguard and Fidelity) = 210,000 Vanguard (V) = 54% =$113,400 Fidelity (F) = 46% = $96,600 Total =$210,000 y=210,000/300,000 =0.7 (portfolio in risky assets) 1-y=90,000/300,000 =0.3 (proportion of Risk-free investment) Vanguard 113,400/300,000 = 0.378 Fidelity 96,600/300,000 = 0.322 Portfolio P 210,000/300,000 = 0.700 Risk-Free Assets F 90,000/300,000 = 0.300 Portfolio C 300,000/300,000 = 1.000
Change in risk exposure (p.150) • Suppose, the investor decides to decrease the risk exposure from 0.7 to 0.56. • Now, the risky portfolio would be=0.56*300,000=$168,000 • This requires a sale of (210,000-168,000)=$42,000 of risky holdings, and use the sale proceeds to purchase risk-free asset • How would the investment of risky asset change? • Sale of Vanguard=42,000*.54=$22,680; • New Vanguard holding=113,400-22,680=$90,720 • Sale of Fidelity=42,000*.46=$19,320 • New Fidelity holding=96,600-19,320=$77,280 • Total Vanguard & Fidelity=90,720+77,280=$168,000 • y=168,000/300,000=.56
Figure 5.5 Investment Opportunity Set with a Risk-Free Investment
CAL and CML return CAL1 CML Efficient Frontier CAL2 CAL3 Rm CAL4 rf P m CAL1 is dominant over CAL2, CAL2 is dominant over CAL3. CML is dominant over CAL1.
Table 5.5 Average Rates of Return, Standard Deviation and Reward to Variability
Use of historical data to predict CML • Use of old data is popular • Old data may not be representative for future • Weight of old data keeps changing • Correction of old data for future is largely subjective, but customary.
Costs and Benefits of Passive Investing • Active strategy entails costs • Free-rider benefit • Involves investment in two passive portfolios • Short-term T-bills • Fund of common stocks that follows a broad market index. Diversification can be based on asset allocation like industry classification, large and small firms, local and foreign firms