Download
1 / 23
230 likes | 501 Views
12.1 First Derivative and Graph. Example 1: Estimate the derivative graphically. To find the derivative at a certain point graphically, draw the tangent line at that point, then find the slope of the tangent line. At x = -3, f’(-3) = -3/-2 = 3/2 (down 3, left 2)- or use slope formula

E N D
Example 1: Estimate the derivative graphically To find the derivative at a certain point graphically, draw the tangent line at that point, then find the slope of the tangent line At x = -3, f’(-3) = -3/-2 = 3/2 (down 3, left 2)- or use slope formula At x = -2.5, f’ (-2.5) = 0 slope of a horizontal line At x = 1, f’ (1) = -1 (approximate) At x = 2.5, f’(2.5) = ½ (approximate)
Example 2: Find the derivative f(x) = x2 + 1 Since f’(x) = 2x therefore f’(-2) = -4 f’(-1) = -2 f’(0) = 0 f’(1) = 2 f’(2) = 4 F(x) What can you conclude about the relationship between the graph of f(x) and the sign of f’(x)? F’(x)
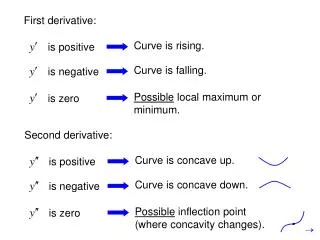
What can you conclude about the relationship between the graph of f(x) and the sign of f’(x) • Note: • If f is increasing: f’(x) > 0 • If f is decreasing: f’(x) < 0
Example 3 Given the function f(x) = x2 - 6x + 10 A) Which values of x correspond to a horizontal tangent line (hint: let f’ = 0). f’(x) = 2x – 6 = 0 x = 3 B) For which values of x is f(x) increasing? Decreasing? To do this, we have to locate all points where f’=0 or f’ is discontinuous. * From part A, we found out that x = 3 for f’(x)=0. * Next, test some numbers on the left of 3 and on the right of 3 (or look at the graph of f(x) to find the interval where f is increasing or decreasing). Left of 3 Right of 3 3 Therefore, f is decreasing on (-∞, 3) and increasing on (3, ∞) - - - - - - - 0 + + + + +
Definition: Critical values The values of x in the domain of f where f’(x)=0 or where f’(x) does not exist are called the critical values of f. The critical values of f are always in the domain of f. Thus, to find the critical values, set f’(x) =0, then solve for x. Also, find the points of the discontinuity. If these values are in the domain of f(x), then they are critical points. To find the increasing interval or decreasing interval, find the derivatives of the points on the left and the right of these critical points. If f’(a) is negative, then that interval is decreasing. If f’(a) is positive, then that interval is increasing.
Partition Numbers andCritical Values A partition number for the sign chart is a place where the derivative could change sign. Assuming that f ’ is continuous wherever it is defined, this can only happen where f itself is not defined, where f ’ is not defined, or where f ’ is zero. Insight: All critical values are also partition numbers, but there may be partition numbers that are not critical values (where f itself is not defined). If f is a polynomial, critical values and partition numbers are both the same, namely the solutions of f ’(x) = 0.
Example 4 Find the critical values of f, the intervals on which f is increasing, and those on which f is decreasing for f(x) = 1-x3 Domain of f(x) is (-∞,∞) F’(x) = -3x2 = 0 x = 0 Since 0 is in the domain of f, x =0 is the critical value for f _ _ _ _ Therefore f is decreasing on (- ∞, 0) and (0, ∞). Since f is continuous at 0, f(x) is decreasing for all x
Example 5 Find the critical values of f, the intervals on which f is increasing, and those on which f is decreasing for f(x) = (1+x)1/3 Domain of f(x) is (-∞, ∞) F’(x) = F’(x) is continuous for all x except x = -1. Since -1 is in the domain of F(x) so -1 is the critical value of f(x) Therefore f is increasing on (- ∞, -1) and (-1, ∞). Since f is continuous at -1, f(x) is increasing for all x + + + +
Example 6 Find the critical values of f, the intervals on which f is increasing, and those on which f is decreasing for f(x) = 1/x Domain of f(x): (-∞, 0) U (0, ∞) because f(x) is undefined at 0 F’(x) is continuous for all x except x = 0. Since 0 is not in the domain of F(x) so 0 is not the critical value of f(x). There is no critical value for thisfunction. Therefore f is decreasing on (- ∞, 0) and (0, ∞) _ _ _ _
Example 7 Find the critical values of f, the intervals on which f is increasing, and those on which f is decreasing for f(x)= 5lnx - x Domain: (0, ∞) or x >0 F’(x) = 5 is in the domain of f(x) so 5 is the critical value. Also, f’(x) is discontinuous at 0, but 0 is not in the domain of f(x) so 0 is not the critical value. Therefore f is increasing on (0, 5) and decreasing on (5, ∞) _ _ _ + + +
Local Extrema When the graph of a continuous function changes from rising to falling, a high point, or a local maximum, occurs, and when the graph changes from falling to rising, a low point, or a local minimum, occurs. Local maximum Local minimum
Theorem 2: Existence of Local Extrema: If f is continuous on the interval (a,b) and f(x) is a local extremum, then either f’(c)=0, or f’(c) does not exist. How to find local extrema: • Find all critical values for f • Test each critical value to see if it produces a local max, a local min, or neither..
Example 8: Which graph is the derivative? increasing decreasing Answer: Graph B decreasing Above 0 Below 0 Below 0 GRAPH A GRAPH B
Example 9 Given f(x) = x3 – 9x2 + 24x -10 • Find the critical values of f(x) F’(x) = 3x2 – 18x + 24 = 0 3 (x2 – 6x + 8) = 0 3(x-2)(x-4) = 0 So x = 2 or 4, both are critical values because they are in the domain of f(x) B) Find the local maxima and minima We need to test on the left and on the right of 2 and 4 Therefore there is a local maximum at 2 and a local minimum at 4. Note: use your G.C to check by looking at the graph increasing decreasing increasing
F(x) Sketch a possible graph of f’(x) Answer: start with the critical points (min, max): -6,2,and 9, then see if f(x) is increasing (f’x >0) or decreasing (f’x <0) F’(x)
F’(x) Sketch a possible graph of y = f(x) Answer: start with the zeros of the function: -7 and 1, then see if f’(x) is above 0 (f is increasing) or f’x is below 0 (f is decreasing). F(x)
Polynomial Functions Theorem 3. If f (x) = anxn + an-1 xn-1 + … + a1x + a0, an 0, is an nth-degree polynomial, then f has at most nx-intercepts and at most (n – 1) local extrema. The derivative is also an important tool for hand-sketching graphs and for analyzing graphs and discussing the interplay between a function and its rate of change.
Example 10 The given graph approximates the rate of change of the U.S. share of the total world production of motor vehicles over a 20- year period, where S(t) is the percentage of share and t is the number of years. A) Write a verbal description of the graph Note that this is the graph of S’(t), not S(t). The U.S. share decreases for the first 6 years, increases for the next 10 years, then decreases again for the last 4 years. (Local min at 6 and local max at 16) B) Sketch a possible graph of y = S(t)
Example 11 The graph of total revenue R(x) (in dollars) from the sale of x desks is given. A) Write a brief verbal description of the graph of the marginal revenue function R’ The graph R indicates that the revenue is increasing on (0, 450) with the maximum at 450 and decreasing on (450, 1000). Thus, the marginal revenue must be positive on (0, 450), equal 0 at 450 and negative on (450, 1000). B) Sketch a possible graph of R’(x)