
024839-2
Projected W. orld Energy Supplies. Projected W. orld Energy Supplies. Careers in Oil & Gas Remain Important. Hydroelectric. Hydroelectric. 1993. 100. 100. 100 BILLION. Solar. , W. ind. BARRELS. Geothermal. New Technologies. 80. 80. World Energy Demand. Billion. Billion.

024839-2
E N D
Presentation Transcript
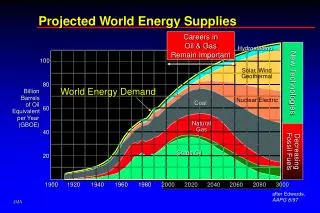
Projected W orld Energy Supplies Projected W orld Energy Supplies Careers in Oil & Gas Remain Important Hydroelectric Hydroelectric 1993 100 100 100 BILLION Solar , W ind BARRELS Geothermal New Technologies 80 80 World Energy Demand Billion Billion Barrels Barrels Nuclear Electric Coal Coal of Oil of Oil 60 60 Equivalent Equivalent per Y ear per Y ear Natural Natural (GBOE) (GBOE) Gas Gas 40 40 Decreasing Fossil Fuels Crude Oil Crude Oil 20 20 1900 1920 1940 1960 1980 2000 2020 2040 2060 2080 3000 1900 1920 1940 1960 1980 2000 2020 2040 2060 2080 3000 024839-2 after Edwards, 24929 AAPG 8/97
Wells Drilled in the USA Most Desired Resource 80 80 Gas Oil Gas 70 70 Oil Oil 60 60 50 50 Percent Dry Percent Dry 40 40 30 30 20 20 Gas Gas 10 10 0 0 1920 1930 1940 1950 1960 1970 1980 1990 1920 1930 1940 1950 1960 1970 1980 1990 American Petroleum Institute, 1994
US Domestic Production Natural Gas Natural Gasoline and Other Hydrocarbons 12 12 and Other Hydrocarbons 10 10 8 8 Thousand Barrels per Day 6 6 Crude Oil 4 4 2 2 0 0 1950 1960 1970 1980 1990 1998 1990 1950 1960 1970 1980 American Petroleum Institute, 1999
1950’s 15% 1960’s 20% 1970’s 36% 1980’s 42% 1990’s 50% 2000’s ? United States Petroleum Imports American Petroleum Institute, 1999
Major Suppliers of Oil to the U.S. Millions of Barrels Per Day 1.68 1.61 1.48 1.36 Venezuela Canada Saudi Arabia Mexico U.S. Dept. of Energy Embassy of Venezuela 12/98 U.S. News & World Report
DOE Oil Price Forecasts Linear Trends Predicted Beginning From the Actual Price of Year Listed 120 1982 1981 100 80 1984 Dollars per Barrel 1985 60 1986 1987 40 Actual 1991 20 1995 0 2005 1975 1980 1985 1990 1995 2000 Year after U.S. Department of Energy, 1998
1998 Oil Price Forecasts Nine Organizations 35 Widely Divergent Forecasts Make Planning Difficult IEA 30 DOE High Mobil 25 $/BBL (1996 Dollars) DRI 20 DOE Base Nat. Res. Canada 15 Nat. West Sec. 10 2000 2005 2010 2015 2020 Pet. Econ. Ltd. Year DOE Low U.S. Department of Energy, 1998
Total O&G Consumption otal O&G Consumption O&G Consumption per $ of O&G Consumption per $ of Gross Domestic Product Gross Domestic Product V8 mpg 1971 - 13.6 1982 - 18.6 1988 - 24.3 1975 1980 1985 1990 1995 1975 1980 1985 1990 US Oil & Gas Consumption/Efficiency Technology Drives Efficiency: Population Drives Consumption 60,000 18 60,000 18 16 16 50,000 50,000 14 14 12 40,000 12 40,000 Total O&G Energy Consumption (Trillion BTU) Total O&G Consumption per GDP (1987$-1000BTU) 10 10 30,000 30,000 8 8 20,000 6 20,000 6 4 4 10,000 10,000 2 2 1995 Robert McGill - AAPG Explorer, 11/95
Impact on Students Linkage of Petroleum Industry and Geoscience Students 60 120 50 100 Petroleum Engineer Graduates (Colorado School of Mines) Oil Price (1996 dollars/barrel) 40 80 $/Barrel 30 60 20 40 10 20 0 0 1900 1910 1920 1930 1940 1950 1960 1970 1980 1990 Year Colorado School of Mines and US Department of Energy, 1997
Worst Case Employment Scenario 1,600,000 1,600,000 1,400,000 1,400,000 1,200,000 Global Energy Demand will Counter Trend 1,200,000 Total Number of Petroleum Industry Employees 1,000,000 1,000,000 800,000 800,000 (FRS Companies) 600,000 600,000 400,000 400,000 200,000 200,000 1974 1979 1984 1989 1994 2000 2005 1974 1979 1984 1989 1994 2000 2005 Arthur L. Smith, CFA - Abilene, Texas, 1996
Geoscience Demographics For a Typical Major Oil Company Age Brackets for Geoscientists Worldwide (2008*) 300 255 250 191 200 Gone Fishing 153 140 150 100 76 50 23 3 0 >25 26-29 30-34 35-39 40-44 45-49 50-54 55-59 60+ Age (YRS) *with normal attrition and no replenishment