Download
1 / 61
610 likes | 626 Views
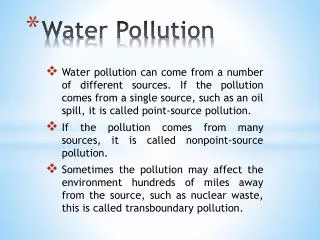
This article discusses the different types of water pollution and their effects, including infectious agents, coliform tests, oxygen demanding waste, plant nutrients, eutrophication, toxic inorganics, organic chemicals, sediments, thermal pollution, and water pollution control.

E N D
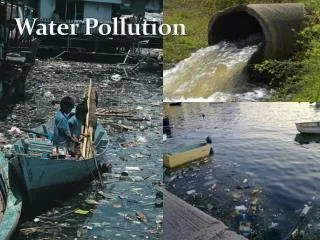
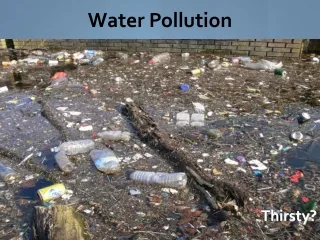
Water Pollution Types and Effects of Water Pollution 2009-10
Infectious Agents • Most serious in terms of human health • Pathogenic organisms • Typhoid, cholera, dysentery, polio, infectious hepatitis, schistosomiasis • Insect transmitted-yellow fever and malaria • Untreated human waste
Developed vs. Developing Countries • Developed- • 90% sewage treatment • 95% clean drinking water • Developing • 2.5 billion people lack adequate sanitation • 80% of all infectious disease • At least 2 million children die from dysentery
Coliform Tests • Residents of colon • Not pathogenic • Detect in water, assume sewage present • Figure 20.4
Oxygen Demanding Waste • BOD • DO • Oxygen Sag • Figure 20.6 • “Flowing waters can recover rapidly from degradable, oxygen-demanding wastes and excess heat through a combination of dilution and bacterial decay.” • BUT……..cannot recover IF……
Plant Nutrients & Eutrophication • Oligotrophic -low nutrients and low productivity • Eutrophic-rich in organisms and organic material • Eutrophication-normal successional process • Chesapeake Bay - a story • Poisoned Waters - Frontline
Cultural Eutrophication • Increased nutrients-nitrates & phosphates • Fertilizers and detergents • Nitric acid (precipitation_ • Human, animal, and industrial wastes
Process of Eutrophication • Increase of aquatic algae and plants • Algae blooms - primarily summer • Ugly-decrease recreational value • Bacterial populations increase • Lower of oxygen levels - fish kill • Marine-red tides
Toxic Inorganics - Heavy Metals • Fatal in as small as parts per million • Mercury poison - 1950s - Minamata, Japan • Bioaccumulation -persistent in ecosystems • Lead, mercury, cadmium • Industrial and leaching from mines
Toxic Inorganics - Salts • Arsenic, chlorides, selenium • Road salts • Irrigation • Mobilization - irrigation and acid precipitation • Road salting
Toxic Inorganics - Acids & Bases • Industries -ammonia, metal plating, petroleum, chemical • Home use - dumped into sewers • Acid mine drainage-sulfuric • “Toxic” precipitation
Organic Chemicals • Thousands of synthetic organics • Pesticides, plastics, fibers, medicines, gasoline, oil, • Many highly toxic • Disposal of household and industrial • Runoff of pesticides • Bioaccumulation and biomagnification
Figure 19-11Page 495 Contaminated Probability Greater than 20 percent 10 to 20 percent Not tested
Sediments • Largest volume/mass of water pollutants • Increased erosion rate - soil loss • Fills lakes, obstructs shipping • Increased cost for industrial users and water purification plants • Block sunlight • Smother insects, etc. • Carry pesticides, bacteria, fertilizers
Thermal Pollution • Aquatic organisms poorly adapted to changes in temperature • Reduce DO • Causes • Industrial - especially electrical plants • Loss of riparian buffers • Increased runoff (decreased infiltration)
Water Pollution Control • Source Reduction • Nonpoint sources and land management • Human Waste disposal
Measuring Water Quality • Coliform bacteria counts(swimming 200 colonies per 100 ml) • DO in water (BOD of waste) • Chemical analysis • Macroinvertebrate assessment (indicator species) • Physical properties: • Temperature • Suspended solids - turbidity
Point and Nonpoint • Point • Discharge pollution from specific locations • Drain pipes • ditches • Sewer outlets • Discrete and identifiable • Easier to monitor and regulate Nonpoint • Scattered or Diffuse • May be Episodic • Precipitation acid and toxic rain • Runoff pavement, lawns, farms construction sites
Figure 19-4Page 486 NONPOINT SOURCES Rural homes Cropland Urban streets Animal feedlot POINT SOURCES Suburban development Factory Wastewater treatment plant Ocean Non-point sources
Figure 19-14Page 500 Cooperstown NEW YORK PENNSYLVANIA ATLANTIC OCEAN Harrisburg NEW JERSEY MARYLAND Baltimore Washington DELAWARE WEST VIRGINIA Richmond Chesapeake Bay VIRGINIA Norfolk Drainage basin No oxygen Low concentrations of oxygen
Open Ocean Pollution • Dumping of toxics, human wastes • Common in developing, often shipped from developed!! • Radioactive wastes • Excessive nutrients • Sediments from land – destroying coral reefs
Petroleum – • Crude and refined – much variation • Sources • Accidents (blowouts and tankers – Valedez)Normal operations • 50-90% - from land and sewers!! • Effects – many variables • Volatile organic hydrocarbons – toxics to many organisms • Crude – coats birds and some mammals • Coat, smother bottom dwellers • Poison bivalves
Toxics in the oceans • Metals and slowly degrading chemicals threaten inland and coastal waters. Toxic materials settle into sea-floor sediments - hazards to benthic organisms that live in and feed on bottom muds. • Persistent chemicals may enter the food web and contaminate the fish and shellfish we eat. • May bioaccumulate and biomagnify
Debris and trash • Almost 300 miles from the nearest inhabited island and over 3000 miles from the nearest continent, Ducie Atoll in the South Pacific is one of the most remote islands
Regulation • The Law of the Sea limits exploitation • The London Convention discourages dumping at sea
Oceans and Nutrient Pollution • Warning Signs • Too many nutrients lead to too little oxygen
Climate Change and the Oceans • Oceans are crucial in shaping climate - they store and move heat around the planet – think of ocean currents • they're a major source and storehouse for gases (such as carbon dioxide) that affect climate • Storms might rage • Shores might be submerged §Sea level would rise if the oceans warmed, If polar ice caps melted, sea level would rise further • A rise of even a few centimeters would flood low-lying islands and coastal cities. • Coral reefs might die back §
Figure 19-15Page 502 Prevention Reduce input of toxic pollutants Separate sewage and storm lines Ban ocean dumping of sludge and hazardous dredged material Protect sensitive areas from development, oil drilling, and oil shipping Regulate coastal development Recycle used oil Require double hulls for oil tankers Cleanup Improve oil-spill cleanup capabilities Require at least secondary treatment of coastal sewage or use wetlands, solar-aquatic, or other sewage treatment methods Require improved air pollution cleanup to reduce input from the atmosphere
Where is Pennsylvania’s Ground Water? Everywhere ! • Below Water Table • Filling pore space • Filling fractures
5 Years Recharge Area Recharge Area Discharge Area
>50% Homes >50% GW Where is Ground-Water Most Important?
Aquifers by Rock Type Sandstone & Shale Carbonate Crystalline Unconsolidated Sand & Gravel
Carbonate Rock Aquifers Sandstone & Shale Carbonate Carbonate Crystalline Unconsolidated Sand & Gravel
Characteristics of Carbonate Rocks Precipitation • Large Openings • High Yields • Vulnerable • High Recharge
Crystalline-Rock Aquifers Sandstone & Shale Carbonate Crystalline Crystalline Unconsolidated Sand & Gravel
GW Discharge to Streams SHERMAN CREEK STREAMFLOW BASEFLOW 85% Baseflow
Waste Disposal – Septic Systems
Wellhead Protection Area contributing Recharge to well Supply Well