Download
1 / 33
330 likes | 498 Views
Risk: The Volatility of Returns. The uncertainty of an investment. The actual cash flows that we receive from a stock or bond investment may be different than the expected cash flows. . The factor that causes the inequality between realized return and expected return. .

E N D
Risk: The Volatility of Returns The uncertainty of an investment. The actual cash flows that we receive from a stock or bond investment may be different than the expected cash flows. The factor that causes the inequality between realized return and expected return.
Risk: The Volatility of Returns • Realized Return: The return that is actually achieved from an investment.
Risk: The Volatility of Returns • Expected Return: The return an investor anticipates generating from an investment. • If the cash flows received from a stock or bond investment are lower than expected, • If the cash flows received are higher than the investor expected, • realized return < expected return. • realized return > expected return.
How is Risk Measured in the Financial Markets? Standard Deviation • How much the prices move around the mean, or average price. • A statistical measurement that highlights historical volatility (fluctuation). • The normal distribution of a set of data is a “Bell Curve”. A bell curve depicts a data set in which the majority of the data falls close to the mean. The further the distance from the mean, the fewer the data points will lie under the curve (in the tails).
Risk Measurement When returns are normally distributed, an individual return will fall within one standard deviation of the mean about 2/3 of the time (the grey area), which is 66.8% of the time. 94.5% of the time, returns are two standards deviations from the mean (the red area).
Risk Measurement High standard deviation signifies a high degree of risk. • If a stock is not very volatile (low risk), it has a low standard deviation and then the bell curve is steeper. This is because an even higher majority of the data lies near the mean. • If a stock is volatile (higher risk), it has a high standard deviation and the bell curve is relatively flatter. This is because the data is spread more evenly under the curve.
Example of Volatility Volatility is the degree to which a stock’s price fluctuates. More fluctuation means the stock is highly volatile and less fluctuation means a stock is less volatile.
Example of Volatility There are several causes that result in realized return to be unequal to expected return. These are called Risks. They both start at $100 and end at $100. However, Stock B has much higher historical volatility than Stock A. Each graph shows the historical prices of two different stocks over 12 months.
Types of Risk There are several causes that result in realized return to be unequal to expected return. These are called Risks.
Interest Rate Risk The risk bondholders face because of the relationship between bond prices and interest rates. Interest rates and bond prices are inversely related. This means, when interest rates go up, the price of bonds will decrease, and vice versa.
Interest Rate Risk What Causes Interest Rate Changes? • There are many factors that can cause inflation, supply and demand of money (both foreign and domestic) and monetary policy. Monetary policy is explained in Module 6. • A bond’s coupon rate is affected by changes in the interest rate.
Interest Rate Risk Bonds can be defined in terms of how they are priced. • Par bond: A bond with a coupon in line with rates offered in the market. • Discount bond: A bond with a coupon below rates offered in the market. • Premium bond: A bond with a coupon above rates offered in the market.
Example Frizzle, Inc. offers a new issue of bonds carrying a 7% coupon ($70 interest payment), paid annually. The bond will mature in 3 years. The face value of the bond is $1,000 and the bond is selling at par or at $1,000 per bond. Question: How is this an example of risk?
What will happen to the bond’s price if interest rates rise to 8%? • If new bonds are now issued, their coupon rate would be 8% and their price would be $1,000.Investors would not pay $1,000 for the older 7% bond when they could purchase the newly issued 8% bond at a price of $1,000. The price of the 7% would have to decline to make it equally as attractive to investors as the 8% bond. • Recall the bond pricing from Module 4:
What if interest rates decrease to 6%? • If interest rates drop to 6%, the bond’s coupon rate will be greater than the interest rate, meaning the bond will be selling at a premium. P0 = ? C = $70 i = 6% N = 3 M = $1000 (value @ maturity) P0 = $1,026.73
Inflationary Risk Inflationary Risk Investors demandto be compensated for how inflation negatively impacts purchasing power. Inflation The rate at which price levels risesacross the entire economy. As inflation occurs, the purchasing power of a dollar falls. In an inflationary period, $1 will not be able to buy as much as it did previously. In other words, one dollar today will not be able to buy as much a year from now.
Liquidity Risk Risk that arises from the difficulty of selling a financial instrument quickly without a significant loss in value. Liquidity:A measure of how quickly an asset can be converted into cash through sale.
Liquidity Risk Stocks or bonds have some degree of liquidity. However, financial instruments differ in their degree of liquidity:
Default Risk Risk that the bond issuer will not be able to repay the principal or pay the scheduled coupon payments to its bondholders.
Foreign Exchange Risk When you invest in a currency other than your own country’s currency, you are taking a risk that movements in foreign exchange rates will adversely affect your return.
Example:On January 7, 2013, $1 was equivalent to $1.30€. This means that $100 could buy 130.70€. On February 4, 2013, $1 was equivalent to 1.3344€. This means that $100 could buy 133.44€. Between January 7and February 4, the US Dollar became stronger against the Euro, allowing the same $100 buy more Euros. Fluctuating exchange rates can make investments, especially foreign investments, to be risky.
With the above information, consider this: • I.N. Vestor is a US investor who wants to invest in the French stock market (Euro is the currency of France). He begins his investment on 1/7/13 and converts $1000 into Euros. He has 1,307.00€ to invest in the French stock market. I.N. Vestor sells his investments on 2/4/13 even though they only realized a 1% return. So, the stocks are worth 1,320.07€. He converts the Euros back into dollars at the exchange rate on 2/4/13: Calculation:(1,320.07€)/(1.3344€/$1) = $989.26 **Even though there was a 1% return in the French stock, the change in exchange rate made the investor lose money. He put $1000 into the investment and received $989.26.
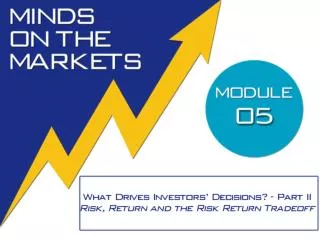
Risk/Expected Return Tradeoff • Risk- Expected Return Tradeoff:Expected return rises with an increase in risk. There is a direct ratio between risk and return. • The goal of an investor is to maximize return while minimizing risk. • Expected risk will be incorporated into expected return as taking on some risk is the price of obtaining returns. If you want to accumulate returns, you must take on some risk.
Risk/Return Tradeoff The slope of the line can change over time.
The red line shows the “Normal Economy”risk - return tradeoff in the economy. The blue line shows a “Booming Economy” where investors are willing to invest money with higher risk and less return because they expect to still achieve the return. The green line shows a “Declining Economy” where an investor requires a greater expected return for taking on more risk.
* Safest places to put your money: Savings accounts (low risk, lower potential for return) | U.S. T-Bills | Bonds | Stocks (high risk, higher potential for return).
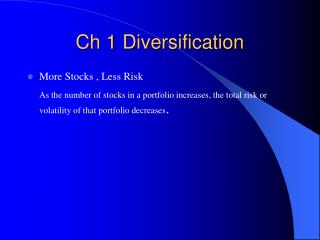
How Can you Manage Risk in the Financial Markets? Diversification: “Don’t put all of your eggs in one basket!” • Diversification helps to decrease risk from a portfolio. It can be achieved by creating a portfolio that contains securities whose prices do not move in a similar manner when the economy changes.
Through diversification, an investor can create a portfolio of high return and high risk securities, maintaining the higher return while reducing overall risk. Refer to the below chart: Portfolio B is the best portfolio to choose. Portfolio B gives the most return and takes on the least risk. Although Portfolio B has the same risk as Portfolio A, it generates more return. Furthermore, it takes on less risk than Portfolio D and generates the same return.