Download
1 / 24
240 likes | 262 Views
2014 Student Success Scorecard Report and District 2010-2016 Strategic Plan Metrics. Presented by Mallory Newell August 25, 2014. De Anza. Foothill. De Anza. 68% Unprepared. Cohort Definition: Completion, Persistence and 30 Unit Completion First time students with intent to complete.

E N D
2014 Student Success Scorecard Report and District 2010-2016 Strategic Plan Metrics Presented by Mallory Newell August 25, 2014
De Anza Foothill
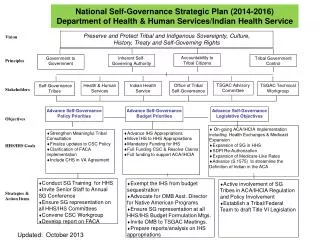
De Anza 68% Unprepared Cohort Definition: Completion, Persistence and 30 Unit Completion First time students with intent to complete. Students who took a credit course for the first time, who completed 6 units in their first 3 years and attempted a Math or English course in their first 3 years. Foothill 57% Unprepared
De Anza Peer Group: San Diego Mesa Las Positas Orange Coast Ohlone Diablo Valley Santa Barbara City L.A. Pierce Moorpark Cuesta Golden West Pasadena City Palomar Mira Costa Fullerton Folsom Lake Skyline Glendale Cypress Sierra Prepared Definition: Percentage of degree, certificate and/or transfer-seeking students starting first time, tracked for six years, who completed a degree, certificate or transfer-prepared. District Metric: Each college will achieve 75% or the highest score within the peer group. Not Targeted Ethnicity Completion – De Anza Overall Unprepared Statewide - Overall Peer Group High 66.9% Targeted Ethnicity Overall Completion Rate by Ethnicity 39% African American (41/105) 50% Filipino (93/185) 44% Latino (189/426) Compared to 82% Asian (1,126/1,381) 61% White (391/641) Prepared/Unprepared based on first course enrolled. Targeted Ethnicity = African American, Latino/a, Filipino. Not Targeted = Native American, Asian, Pacific Islander, White, Unreported.
Foothill Peer Group: San Francisco City Irvine Valley Saddleback Marin San Diego Miramar West Valley San Mateo Cañada Prepared Not Targeted Ethnicity Completion – Foothill Overall Unprepared Peer Group High 64.3% Statewide - Overall Targeted Ethnicity Overall Completion Rate by Ethnicity 40% African American (21/52) 62% Filipino (16/26) 38% Latino (56/149) Compared to 85% Asian (224/263) 66% White (262/399) Prepared/Unprepared based on first course enrolled. Targeted Ethnicity = African American, Latino/a, Filipino. Not Targeted = Native American, Asian, Pacific Islander, White, Unreported.
Peer Group High 84% Not Targeted Prepared Overall Targeted Unprepared 74% 67% +6% 67% 59% +5% DA CA Completion +3% +4% 48% 71% 81% 64% 64% 52% 41% +1% 45% +5% +2% +4% +2% +3% 2014 Report Year +/- between 2003-04 to 2007-08 cohorts FH -3%
Statewide - Overall Not Targeted Ethnicity Persistence – De Anza Definition: Percentage of degree, certificate and/or transfer-seeking first time students tracked for six years who enrolled in four consecutive terms. District Metric: No gap between groups. Overall Prepared Targeted Ethnicity Unprepared Peer Group High 83.1% Overall Persistence Rate by Ethnicity 64% African American (67/105) 81% Filipino (149/185) 66% Latino (281/426) Compared to 75% Asian (1,041/1,381) 68% White (434/641) Persistence Gap (compared to White) African Americans = 4% Filipino = No gap Latino = 2% Prepared/Unprepared based on first course enrolled. Targeted Ethnicity = African American, Latino/a, Filipino. Not Targeted = Native American, Asian, Pacific Islander, White, Unreported.
Prepared Statewide - Overall Persistence – Foothill Not Targeted Ethnicity Overall Unprepared Targeted Ethnicity Peer Group High 78.1% Overall Persistence Rate by Ethnicity 64% African American (33/52) 73% Filipino (19/26) 59% Latino (88/149) Compared to 78% Asian (204/263) 69% White (274/399) Persistence Gap: African American = 5% Filipino = No gap Latino = 10% Prepared/Unprepared based on first course enrolled. Targeted Ethnicity = African American, Latino/a, Filipino. Not Targeted = Native American, Asian, Pacific Islander, White, Unreported.
Not Targeted Ethnicity Unprepared Prepared Targeted Ethnicity 30 Unit Completion – De Anza Overall Definition: Percentage of degree, certificate and/or transfer-seeking first time students, tracked for six years who achieved at least 30 units. Statewide - Overall Peer Group High 78.1% Overall 30 Unit Completion Rate by Ethnicity 70% African American (73/105) 85% Filipino (158/185) 67% Latino (285/426) Compared to 82% Asian (1,133/1,381) 78% White (499/641) Prepared/Unprepared based on first course enrolled. Targeted Ethnicity = African American, Latino/a, Filipino. Not Targeted = Native American, Asian, Pacific Islander, White, Unreported.
Not Targeted Ethnicity Prepared 30 Unit Completion – Foothill Overall Unprepared Statewide - Overall Targeted Ethnicity Peer Group High 74.6% 30 Unit Completion Rate by Ethnicity 71% African American (37/52) 77% Filipino (20/26) 59% Latino (88/149) Compared to 79% Asian (207/263) 74% White (294/399) Prepared/Unprepared based on first course enrolled. Targeted Ethnicity = African American, Latino/a, Filipino. Not Targeted = Native American, Asian, Pacific Islander, White, Unreported.
Not Targeted Ethnicity Definition: Percentage of students who started 1-4 levels below transfer level English tracked for six years, who complete college level English. District Metric: Each college will achieve 85% or the highest score within the peer group. Overall Basic Skills English – De Anza Targeted Ethnicity Peer Group High 72.1% Statewide - Overall Overall Rate by Ethnicity 51% African American (50/98) 75% Filipino (123/164) 57% Latino (214/377) Compared to 84% Asian (632/757) 71% White (245/345) Prepared/Unprepared based on first course enrolled. Targeted Ethnicity = African American, Latino/a, Filipino. Not Targeted = Native American, Asian, Pacific Islander, White, Unreported.
Basic Skills English – Foothill Not Targeted Ethnicity Overall Peer Group High 62.4% Targeted Ethnicity Statewide - Overall Overall Rate by Ethnicity 52% African American (31/60) 32% Filipino (8/25) 48% Latino (84/177) Compared to 70% Asian (56/80) 63% White (157/248) Prepared/Unprepared based on first course enrolled. Targeted Ethnicity = African American, Latino/a, Filipino. Not Targeted = Native American, Asian, Pacific Islander, White, Unreported.
Definition: Percentage of students who started 2-4 levels below transfer level math tracked for six years, who complete 1 level below college level math. Basic Skills Math – De Anza Not Targeted Ethnicity Peer Group High 53.5% Overall Targeted Ethnicity Overall Rate by Ethnicity 44% African American (57/129) 53% Filipino (101/190) 41% Latino (196/483) Statewide - Overall Compared to 69% Asian (317/462) 55% White (297/542) Prepared/Unprepared based on first course enrolled. Targeted Ethnicity = African American, Latino/a, Filipino. Not Targeted = Native American, Asian, Pacific Islander, White, Unreported.
Not Targeted Ethnicity Basic Skills Math – Foothill Overall Peer Group High 50% Targeted Ethnicity Statewide - Overall Overall Rate by Ethnicity 38% African American (18/47) 35% Filipino (7/20) 39% Latino (57/148) Compared to 60% Asian (25/42) 60% White (141/237) Prepared/Unprepared based on first course enrolled. Targeted Ethnicity = African American, Latino/a, Filipino. Not Targeted = Native American, Asian, Pacific Islander, White, Unreported.
Definition: Percentage of students who started at any level below transfer level ESL tracked for six years, who complete ESL series or college level English. Basic Skills ESL – De Anza Peer Group High 65.4% Not Targeted Ethnicity Overall Rate by Ethnicity 29% African American (7/24) 50% Filipino (5/10) 13% Latino (9/70) Overall Statewide - Overall Compared to 52% Asian (332/644) 36% White (37/104) Targeted Ethnicity Prepared/Unprepared based on first course enrolled. Targeted Ethnicity = African American, Latino/a, Filipino. Not Targeted = Native American, Asian, Pacific Islander, White, Unreported.
Basic Skills ESL – Foothill Not Targeted Ethnicity Peer Group High 58.3% Overall Overall Rate by Ethnicity 33% African American (<10) 0% Filipino (0) 16% Latino (18/114) Statewide - Overall Compared to 61% Asian (82/135) 46% White (27/59) Targeted Ethnicity Prepared/Unprepared based on first course enrolled. Targeted Ethnicity = African American, Latino/a, Filipino. Not Targeted = Native American, Asian, Pacific Islander, White, Unreported
CTE Completion– De Anza Definition: Students who complete a CTE course for the first time and complete more than 8 units in 3 years in a single discipline who, within 6 years, complete a degree, certificate or transfer-prepared. District Metric: Each college will achieve 90% or the highest rate within the peer group. Not Targeted Ethnicity Peer Group High 68.8% Statewide - Overall Overall Targeted Ethnicity Overall Rate by Ethnicity 61% African American (77/126) 64% Filipino (93/146) 56% Latino (267/479) Compared to 66% Asian (894/1,342) 57% White (459/803) Prepared/Unprepared based on first course enrolled. Targeted Ethnicity = African American, Latino/a, Filipino. Not Targeted = Native American, Asian, Pacific Islander, White, Unreported.
CTE Completion– Foothill Peer Group High 55.2% Overall Statewide - Overall Not Targeted Ethnicity Targeted Ethnicity Overall CTE Completion Rate by Ethnicity 44% African American (27/61) 52% Filipino (33/63) 38% Latino (95/253) Compared to 52% Asian (292/563) 41% White (342/835) Prepared/Unprepared based on first course enrolled. Targeted Ethnicity = African American, Latino/a, Filipino. Not Targeted = Native American, Asian, Pacific Islander, White, Unreported.
DA FH
4% gap 11% gap 7% gap 7% gap 14% gap Definition: Students who received a successful grade in any quarter within 2013-14. District Metric: Each college will achieve less than a 5 percentage point difference between the rate of historically underserved groups and all other groups. Course Completion – De Anza (9,155) (30,731) (849) (5,566) (65,748) (623) (29,774) Decline to State not graphed.
13% gap 8% gap 21% gap 5% gap 12% gap Course Completion – Foothill (3,737) (13,608) (921) (3,163) (21,552) (474) (24,824) Decline to State not graphed.
Definition: Percentage of public high school graduates from the FHDA service area who enrolled at FHDA in the following fall quarter. Service Area = Fremont Union, Mountain View-Los Altos and Palo Alto districts. District Metric: The participation rate will increase to 30%. High School Participation