Download
1 / 16
170 likes | 210 Views
Learn about point estimation, interval estimation, target parameters, point estimators, efficient estimators, unbiased estimators, and consistency in estimating population parameters using statistics.

E N D
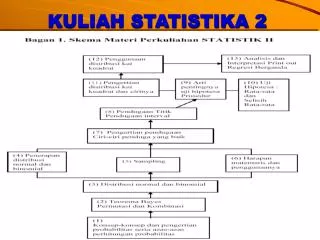
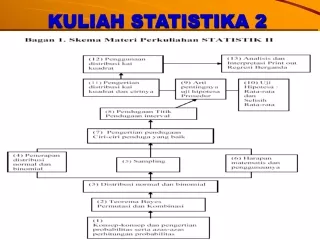
ESTIMATION METHODS Estimation PointEstimation IntervalEstimation
POINT ESTIMATION Thinking Challenge Suppose you’re interested in the average amount of money that students in this class (the population) have on them. How would you find out?
Rp. 50.000 Or Rp. 25.000 – Rp. 100.000
Estimate PopulationParameter... with Sample Statistic x Mean ^ Proportion p p 2 2 Variance s Differences - x - x 1 2 1 2 • Term of estimation • Parameter • Statistic • Estimator • Estimate
What is point estimate? A point estimate is a single value (statistic) used to estimate a population value (parameter). Ex:
Random Sample MeanX= 50 The scores of 50 students of mid test value Identify the target parameter and the point estimator if 10 randomly choosen of student! Sample ESTIMATION PROCESS Population Mean, , is unknown Ex:
The scores of 50 students of mid test value Identify the target parameter and the point estimator if 10 randomly chosen of student! Randomly chosen How about population ?
and or and These random variables are examples of statistics or estimators These fixed constants are examples of parameter or targets or Is unbiased estimator of If CRITERIA FOR EVALUATING BEST ESTIMATOR • Unbiased estimators E(S2)=2
True µ = E(X) bias µ E(X) Bias = E(x) - µ
Estimators called efficient if the distribution of an estimator to be highly concentrated or have a small variance than another. • Efficient estimators (minimum variance) 2a 2b 2b< 2a b efficient estimator than a Efficiency of u relatif to w Var (w) / Var (u)
Lim E(Xn) = µ n ∞ Lim Var(Xn) = 0 n ∞ One of conditions that makes an estimator consistent is: If its bias and variance both appraoach zero • Consistent estimator and NOTE: Consisteny is more abstract, because it defined as a limit: A consistent estimator is one that concentrates in a narrower and narrower band aroud its sample size n increases indefinitely .
Conclusion of Point Estimation • Provides a single value • Based on observations from one sample • Gives no information about how close the value is to the unknown population parameter • Example: Sample mean x = 3 is point estimate of unknown population mean
EXERCISE • Suppose each of the 200.000 adults in city under study has eaten a number X of fast-food meals in the past week. However, a residential phone survey on a week-day afternoon misses those who are working-the very people most likely to eat fast foods. As shown in the table below, this leaves small population who would respond, especialy small for higer values of X.
Find the mean µ of the whole targets population? • Find the sample mean of the subpopulation who would respond? • What is the estimator efficient of unbiased? • Suppose that a surveyor is traying to determine the area of a rectangular field, in which the measured length X and the measuered width Y are independent random variabeles that fluctuate widely about the true values, according to the following probability distribution • The calculte area A = XY of course is a random variable, and is used to estimate the true area. If the true length and width are 10 and 5, respectively, • Is X an unbiased estimator of the true length? • Is Y an unbiased estimator of the true width? • Is A an unbiased estimator of the true area?