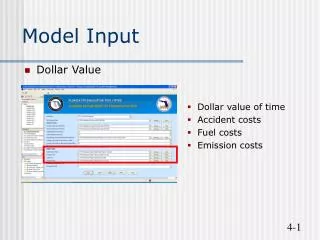
Model input for Banks Pumping Plant
50 likes | 171 Views
This document presents a comprehensive analysis of the Banks Pumping Plant's operations, including energy wholesale prices from July 2005 and hourly variations in pumping activities during July and August 2004. It includes findings on stage difference errors in flow estimates and their impact on water management in the region. Observations reveal significant daily fluctuations in pumping rates, emphasizing the need for hourly data integration to improve accuracy in estimating cumulative flow into Clifton Court Forebay (CCFB) and other Delta channels.

Model input for Banks Pumping Plant
E N D
Presentation Transcript
Figure III.2.iii-3. Statistics of hourly variation in Banks pumping in July and August 2004.
Table III.2.iii-2. Error in flow estimates corresponding to error in stage differences estimated between Clifton Court Forebay and West Canal. Gate equations from Hills (1988). A gate position of 15 is assumed. 3000 cfs ≈ 250 AF/hourCCFB surface area ≈ 2100 acresDifference of 3000 cfs in pumping ≈ 1.4”/hour or 0.7’ in 6 hours Tidal amplitude in Old River near Santa Fe Cut ≈ 15,000 cfs
Observations – Banks pumping • Banks pumping varies considerably over a day • Use of daily average could lead to error in CCFB stage estimate by many inches • Estimate of flow into CCFB could be thousands of cfs, significant %’s of flow in S Delta channels • Incorporate hourly pumping as input