Download
1 / 25
250 likes | 434 Views
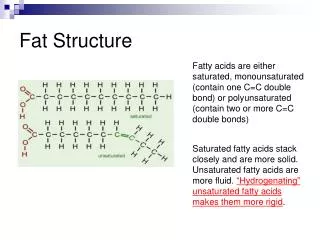
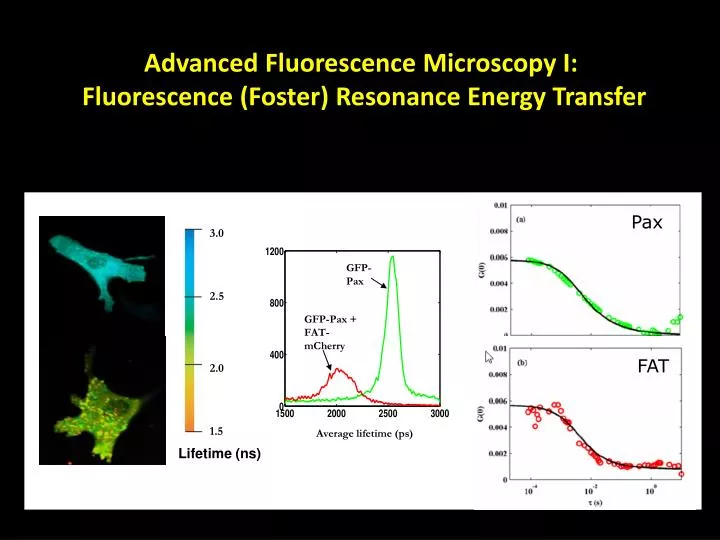
3.0. GFP-Pax. 2.5. GFP- Pax + FAT- mCherry. 2.0. Average lifetime ( ps ). 1.5. Advanced Fluorescence Microscopy I: Fluorescence (Foster) Resonance Energy Transfer. FAT. Pax. FAT. Lifetime (ns). Paxillin-FAT in endothelial cells. GFP-Paxillin. FAT-mCherry. Spectral overlap.

E N D
3.0 GFP-Pax 2.5 GFP-Pax + FAT-mCherry 2.0 Average lifetime (ps) 1.5 Advanced Fluorescence Microscopy I: Fluorescence (Foster) Resonance Energy Transfer FAT Pax FAT Lifetime (ns)
Paxillin-FAT in endothelial cells GFP-Paxillin FAT-mCherry Spectral overlap
Fluorescence Resonance Energy Transfer (FRET) Dipole - dipole interaction r6 dependence Efficiency 50% energy transfer Förster distance R0 = 40 to 70 Å Decrease donor intensity Increase acceptor intensity Decrease donor lifetime
Apply Lifetime Resolved FRET to Study Receptor Mediated Signaling I Verveer, Science 2000
Apply Lifetime Resolved FRET to Study Receptor Mediated Signaling II Verveer, Science 2000 Verveer, Science 2000
Apply Lifetime Resolved FRET to Study Receptor Mediated Signaling III Verveer, Science 2000
Mechanotransduction Cardiac Hypertrophy Remodeling of Cellular & Tissue Phenotype Intracellular signaling cascade http://www.cincinnatichildrens.org Arteriosclerosis Mechanical Forces (shear, stretch, geometric confinement) www.bodyrepairstore.com
Focal adhesion complex Focal adhesion complex serves as the adhesion sites of cells and mechano-signal transduction center of the cell Quantification of Paxillin-Focal adhesion kinase interaction
Fluorescence Resonance Energy Transfer (FRET) Dipole - dipole interaction r6 dependence Efficiency 50% energy transfer Förster distance R0 = 40 to 70 Å Decrease donor intensity Increase acceptor intensity Decrease donor lifetime
Quantification of Mechanotransduction withFoster resonance energy transfer (FRET) MscL activation Srcphosphorylation dynamics Wang et al., Nature 2005 Corry et al., BJ 2005 GPCR conformation change Na et al., PNAS 2008 Chachivilis et al., PNAS 2008
What can we quantify? • Is there binding? Presence or absence of FRET • What is the conformation of the bound molecule? FRET Efficiency: • What is the fraction of molecule bound? FRET ratio: • What is the thermodynamic constants of binding? Dissociation constant & Gibb’s free energy Use fluorescence correlation spectroscopy to get [F]
Fluorescence Correlation Spectroscopy (FCS) Poisson statistics:
Thermodynamics of Pax/FAT Interaction • FAT-mChcyto + GFP-Paxcyto • FAT-mCh---GFP-Paxcyto koff kon F F P P F [FAT] * [Pax] Paxillin P F P Kd = FAT F P F P F P F [FAT-Pax] P P F F P F F F F F F P P P P P P kon kon koff koff F P Bovine aortic endothelial cells (BAECs) Co-transfected with Pax and FAT plasmids actin Focal adhesion plaque Cell membrane
How to measure kd & G spectroscopically [FAT] * [Pax] Kd = [FAT-Pax] [Pax] = 1 [FAT-Pax] 1 – FRETratio η= 1 – FRETlifetime non-FRETlifetime B = Green molecule intensity/Cgfp = [Pax] +(1-η)[FAT- Pax] C = Red molecule intensity/Cmc= [FAT] + [FAT-Pax] + B/γ • FRET / FLIM For a given cell, measure concentrations or ratio of concentrations Cgfp is the brightness of gfp, Cmc is the brightness of m-cherry, g is a parameter characterizing bleedthrough from the green to the red channel Solve simultaneous equations to obtain Kd. Calculate Gibbs free energy,ΔG = RT lnKd In vitro systems exist to measure Kd for purified protein pairs e.g. isothermal titration calorimetry (ITC) and surface plasmon resonance (SPR) but no in vivo methods exist.
Typical FLIM-FRET & FCS data 3.0 GFP-Pax 2.5 GFP-Pax + FAT-mCherry 2.0 Average lifetime (ps) 1.5 FAT Pax FAT Lifetime (ns)
Quantification of a single cell Cell image pseudo-colored by FRET ratio Fixed τ1 = 2.6ns, fit τ2 = 1.9ns R ~ 56Ǻ η = 1 - τ2/τ1 = 0.2692 Solve simultaneous equations to obtain Kd FRET / FLIM: [FAT-Pax] = A FCS @ 890nm: [Pax] +(1-η)[FAT- Pax] = B FCS @ 780nm: [FAT] + [FAT-Pax] + B/17 = C Cell intensity in red channel [Pax] + [FAT-Pax] Cell intensity in green channel FCS FRET
Thermodynamics of Pax/FAT Interaction in a single cell [FAT] * [Pax] Kd = Histogram of Kd for cytosolic region [FAT-Pax] [FAT-Pax] [FAT] = Kd [Pax] [FAT] vs [FAT-Pax]/[Pax] [FAT] Gradient = 209nM . Pixels within 3 bins on either side of histogram peak Linear fit result [FAT-Pax]/[Pax] • Histogram peaks at Kd value ~200nM
Variation of DG across different cells Measurement of 10 distinct cells over three days Error bars are std dev in one cell
Compare kd & G with in vitro system Spectroscopic measurement: Kd= 367 ± 33 nM (S.E. 10 cells) In vitro results: • Isometric Titration Calorimetry (ITC) • Kd ~ 10 μM for FAT + 1 LD domain of Pax Gao et. al. J. Biol Chem. 2004 Thomas et. al. J. Biol Chem. 1999 • Surface Plasmon Resonance (SPR): • Kd ~ 4 μM for FAT + 1 LD domain of Pax • Kd ~ 300 – 600 nM for FAT + both LD domains of Pax that bind FAT Paxillin-FAT interaction shows significant allosteric effect both in vivo & in vitro
Is paxillin-FAT binding mechno-sensitive? Apply bi-axial stretching (up to 10%)
Chemical disruption to mechanotransduction Cytochlastin D Genistein Blocks actin polymerization Blocks protein tyrosine phosphorylation
Blocking of stretch responses Disruption of actin cytoskeleton (via cytoD) reduces mechanotransduction Blocking tryosinephosphorylation does not block mechanotransduction