Download
1 / 15
150 likes | 170 Views
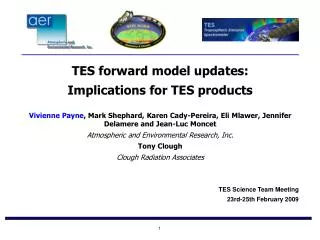
TES forward model updates: Implications for TES products Vivienne Payne , Mark Shephard, Karen Cady-Pereira, Eli Mlawer, Jennifer Delamere and Jean-Luc Moncet Atmospheric and Environmental Research, Inc. Tony Clough Clough Radiation Associates TES Science Team Meeting

E N D
TES forward model updates: Implications for TES products Vivienne Payne, Mark Shephard, Karen Cady-Pereira, Eli Mlawer, Jennifer Delamere and Jean-Luc Moncet Atmospheric and Environmental Research, Inc. Tony Clough Clough Radiation Associates TES Science Team Meeting 23rd-25th February 2009
Carbon dioxide spectroscopy • Current CO2 parameters in TES forward model • HITRAN strengths, widths etc • P, Q and R branch line coupling coefficients based on Niro et al. (2005) • Jean-Michel Hartmann’s group • Databases supplied with Hartmann’s code were based around HITRAN 2000 • Implementation of Hartmann’s line coupling scheme was a major improvement! • CO2 line strengths/positions from method of Tashkun et al. (1999) • Carbon Dioxide Spectroscopic Database (CDSD) • Implemented for the MIPAS forward model (Flaud et al., 2003) • (MIPAS team don’t have to worry as much about line coupling) • Implementation of new parameters in LBLRTM • Required re-calculation of line coupling parameters • Some work needed to get Hartmann’s scheme to use alternative parameters • Recently completed, comparisons performed with AIRS and IASI data • Results: Improved consistency across spectral regions!
Water vapor spectroscopy • Current water vapor line strengths/positions used by TES forward model: • HITRAN 2004 • From an analysis by Bob Toth (JPL) • Coudert et al. (2008), J. Mol. Spec. • Some new measurements • Some re-fitting of available measurements • Strengths of stronger lines are ~5-7 % weaker than HITRAN 2004 • Validation of Coudert parameters at AER • Primarily using IASI data, also AIRS • Provides some confidence in the Coudert parameters • Shephard et al., 2009, in preparation • For imminent submission to ACP IASI special issue • Toth is working on a re-analysis • New analysis indicates his strengths are within 1 % of Coudert’s • Future work: • Assessment of temperature dependences for widths from Bob Gamache (UMass)
Impact of line file differences on line-by-line calculations CO22 H2O 2 CO23 Differences have some impact in all TES microwindows!
Impact of line file differences in Susan’s CO2 microwindows Spectrum Impact of line file differences Susan’s averaged CO2 residuals
What is ‘Truth’? • Spectral Residuals are Key! • Radiance closure studies • Consistency within a band system for a given species • e.g.2 band to investigate consistency for CO2 • Consistency between bands • AIRS/IASI 2 and 3 bands to investigate consistency for CO2 • Consistency between species • TES: temperature from O3 and H2O consistent with CO2 ; N2O • Consistency between instruments - SHIS - AERI - AIRS - ACE • TES - MIPAS • IASI
Consistency across spectral regions Mean residuals from 36 ARM TWP cases: Profile inputs from AIRS Phase I val. supplied by L. Strow and S. Hannon. LBLRTM CO2 line strengths Tashkun et al. (1999) CO2 line coupling Application of Niro et al. (2005) code to Tashkun line parameters CO2 continuum Empirical correction constructed using ARM ground-based interferometer meas. Future improvements will focus on the physics of the line coupling in this region H2O line parameters Coudert et al. (2008) Example AIRS spectrum Older lblrtm version Current lblrtm release Preliminary lblrtm version Significant improvements to consistency between spectral regions! Caveat: Establishing “truth” for water vapor remains problematic……
Impact on TES retrievals • Direct impact on temperature retrievals (example case below) • Larger number of cases required to assess the effect on the bias and rms • Direct impact on H2O retrievals • Direct impact on CO2 retrievals • Impact of temperature on other species • Impact of interfering H2O lines in microwindows of other species New “beta” line file results in warmer retrieved temperatures in mid-upper troposphere for this case. Potentially helpful in addressing cold bias.
Ozone spectroscopy • Current TES O3 line parameters: • ozone line list obtained from M. Birk • Measurements from Wagner et al. • Adopted by MIPAS team • We adopted these early on…. • HITRAN 2004 parameters • updated to incorporate Wagner meas. • Fitting across bands means they are not quite the same as TES line file, but close! R branch not used in TES retrievals P branch used in TES retrievals Averaged TES spectral residuals in the ozone band (Beer et al., 2005) • Stare observations and co-located ozone sondes • Provide opportunity for in-depth assessment of ozone spectroscopy
Methane spectroscopy • Methane line coupling available from Hartmann’s group • Databases and software described in Tran et al. (2006) • Not currently implemented in LBLRTM…. • …. But we have the necessary tools in-house to do this • Impact of implementation has not yet been evaluated
Tony Clough Effect of Hartmann’s Line Coupling vis a vis Voigt Differences of up to 1% in transmittance at 400 mbar
Summary • New CO2 line strengths/positions from Tashkun et al. • result inimproved consistency across spectral regions • New H2O line strengths/positions from Coudert et al. • have been adopted for the next AER LBLRTM package release • Updates to TES line file would have implications for all products. • Potential to reduce biases? • Important to thoroughly assess the impact of any changes • Other future work: • Ozone spectroscopy • Stare observations provide opportunities for in-depth assessment • Methane spectroscopy • Capability exists to add methane line coupling.