Download
1 / 33
330 likes | 439 Views
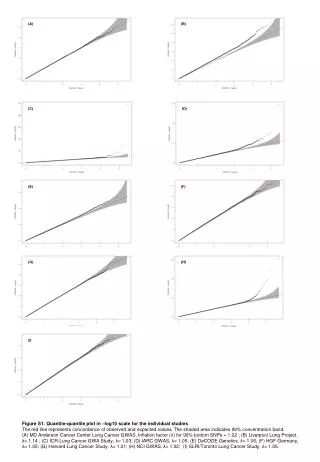
Discover the intricacies of extreme value theory with a detailed examination of the Generalized Extreme Value Distribution (GEV) and the Generalized Pareto Distribution (GPD). This overview explores the mathematical foundations of the Fisher-Tippett theorem, empirical mean excess functions, and modeling extreme events using Poisson processes. Analyze data from the Surveyor Project, including estimations of thresholds, block-wise maxima, and the impact of outliers on the GEV for reliable quantile estimation. Essential for researchers in statistics and data science.

E N D
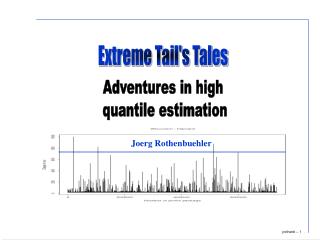
Extreme Tail's Tales Adventures in high quantile estimation Joerg Rothenbuehler
Generalized Extreme Value Distribution (GEV) The three EVD can be represented by a single three parameter distribution, called the GENERALIZED EVD (GEV):
The Empirical Mean Excess Function The empirical mean excess function of a GPD with
Modeling Extreme Events: • The number of exceedances of a high threshold follows a Poisson process (iid exp. distributed interarrival times) • Excesses over a high threshold can be modeled by a GPD • An appropriate value of the high threshold can be found by plotting the empirical mean excess function. • The distribution of the maximum of a Poisson number of iid excesses over a high threshold is a GEV with the same shape parameter as the corresponding GPD.
Extremal Index of a Stationary Time Series • The extremal index measures the dependence of the data in the tails. • can be interpreted as the average cluster size in the tails: High values appear in clusters of size • means there is no clustering in the tails. • If the data does not show strong long range dependence, but has extremal index , its maxima has distribution , where H is the GEV of iid data with the same marginal distribution. • GPD analysis may not be appropriate for data with
The Data: Surveyor Project • One way delays of probe packets during one week • Packets sent according to a Poisson process with a rate of 2/sec • Packet is time-stamped to measure delay • If delay >10 sec, packet assumed lost, discarded • Saturday and Sunday excluded for analysis • More details: http://telesto.advanced.org/~kalidindi/papers/INET/inet99.html
Time-Series Plot Colorado-Harvard Monday 12:00am - Friday 8:00 pm
Estimation of Shape Parameter as a function the used threshold using GPD
Fit of a GPD-Distr. for Colorado-Harvard • threshold = 107.774 • Quantile of threshold = 0.9993536 • Number of exceedances = 500 • Parameter estimates and Standard Errors xi beta -0.3319409 86.50868 0.03683419 4.844786
Estimations based on GPD Fit p quantile sfall empirical quantile 0.99940 114.13890 177.50201 115.638 0.99950 129.06973 188.71184 130.8681 0.99960 146.15561 201.53964 147.7083 0.99970 166.39564 216.73554 165.8802 0.99980 191.83186 235.83264 190.7157 0.99990 228.12013 263.07730 229.9743 0.99995 256.94996 284.72227 252.4705 0.99999 303.07272 319.35051 311.1122 1.00000 368.3887 368.3887 329.237
Quantile estimation as a function of the threshold 99.995% Estimate Empirical quantile
Fitting a GEV to block wise maxima Block 1 Block 2 Block 3 Block 4 Block 5
GEV-Fit Results for different Block sizes • Block size = 7200 : 108 Blocks xi sigma mu Estimation -0.3375603 59.75591 197.1503 Std. Error 0.0734163 4.69351 6.4305 • Block size = 14400 : 54 Blocks xi sigma mu Estimation -0.4346847 51.7389 235.2513 Std. Error 0.1256784 6.2025 8.0083
High Level Estimation Level exceeded during 1 of 50 hours Block size Lower Estimate Upper 1h 314.8669 326.7487 355.9581 1.5 h 318.4539 327.3824 357.6406 2h 315.7877 324.6415 352.1868 Level exceeded during 1 of 100 hours Block size Lower Estimate Upper 1h 322.4220 336.7065 371.3975 1.5h 325.7779 335.4343 371.0107 2h 324.3893 332.4487 365.1899
Does GPD always work? The Army-Lab. – Univ. of. Virginia dataset Time Series Plot ACF Plot, Lags:1-1000 PACF Plot, Lags: 1-1000 ACF Plot, Lags:5-1000
What goes wrong beyond the LRD: Empirical Mean Excess Function Shape Parameter
Non-Stationarity: Harvard to Army- Lab. Time Series Plot: Monday 12 am – Friday 8 pm
Pick a few hours per day! Mean Excess Plot 11am – 4pm Mon - Fri Empirical Tail Distr. Shape Parameter Estimation
Single Outlier: Virginia - Harvard Empirical Tail Distr. Monday 12am – Friday 8pm ACF, Lag 3-1000 Estimation of Extremal Index
The effect of the outlier on GEV • Fit Without outlier: Block size = 14400 53 Blocks xi sigma mu -0.4988539 45.08995 117.2362 x1=280.101 0.09091089 5.217626 6.735118 • Fit With outlier Block size = 14400 53 Blocks xi sigma mu -0.09130441 44.97725 109.3819 x1=1242.969 0.06274905 4.576706 6.716929
The effect of the single outlier on GPD: Analysis with outlier Analysis without outlier
Conclusions: • The GPD is a model that can be fitted to the tails of a distribution. The quality of the fit can be checked with various methods. From the model, we can gain quantile estimates at the edge of or outside the data range. However, a good fit is often not possible. • The GEV provides a model for the distribution of block wise Maxima. Its use is supported by EVT for stationary time series without strong LRD, while GPD is only supported in the iid case. The quality of fit can be checked with similar tools as in the GPD model. Certain problems remain, and reliable quantile estimates are not available.
Acknowledgements: • Applied Research Group at Telcordia: • E. van den Berg • K. Krishnan • J. Jerkins • A. Neidhardt • Y. Chandramouli • Cornell University: • Prof. G. Samorodnitsky