Download

1 / 17
170 likes | 292 Views
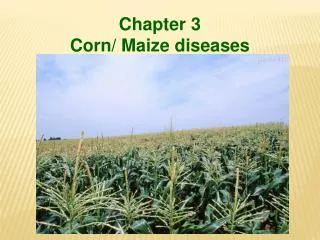
Daryl Herzmann Jeff Wolt Raymond Arritt Mark Westgate Susana Goggi Iowa State University. 166-7: Modeling Out Crossing Probabilities for Maize in Iowa. Motivation. Development of transgenic crops depends on successful isolation and confinement.

E N D
Daryl Herzmann Jeff Wolt Raymond Arritt Mark Westgate Susana Goggi Iowa State University 166-7: Modeling Out Crossing Probabilities for Maize in Iowa
Motivation • Development of transgenic crops depends on successful isolation and confinement. • Maize presents a challenging confinement problem due to open pollination and prevalence in Iowa. • Directly monitoring Out Crossing (OC) at each field of interest is impractical. • Can a regulatory air dispersal model be utilized with Iowa Mesonet data and our knowledge of maize physiology to predict/analyze OC events?
AERMOD, Regulatory Model • Models air dispersal based on planetary boundary layer turbulence structure and scaling • Preferred model of the EPA replacing the ISC3 model on October 21, 2005. • Utilize the relatively new dry deposition algorithms of AERMOD to model pollen dispersal • Input weather data taken from the Iowa Environmental Mesonet
IEM Data Representativeness • The Iowa Mesonet collects, processes, checks and archives environmental data produced from disparate networks. • An analysis was performed to determine the spatial scales IEM data could be utilized at.
Nearest Neighbor Index The NNI is a simple ratio between the mean minimum distance and expected distance by chance of sampling points over some sampling area. Tier 1 is a combination of the ASOS and AWOS networks.
Representativity Results • The IEM is spatially representative at a scale of roughly 25-30 km. • Arbitrary combination of all data sources leads to clustering and degradation of data quality at finer scales. • http://mesonet.agron.iastate.edu/info/nni.phtmlor Google “IEM Representativity” • Representativity results are used to produce quality information to drive our OC modelling effort.
Developing OC knowledge • Measure OC for seed production in Iowa • Model OC with a regulatory compliant model (AERMOD) and validate result • Interface model with a regional weather monitoring network (IEM) • Develop retrospective and prospective tools for regionally based OC monitoring & Prediction
Measure OC for Seed Production • Data collected during a 3 year monitoring of commercial seed production fields • Out-crossing observations along in-field transects Ireland, D.S., et al: 2006. Managing Reproductive Isolation in Hybrid Seed Corn Production. Crop Science, 46, 1445-1455.
Model validation fields Validate modelling approach using AERMOD and IEM data against an observed pollen out crossing dataset. Selected 8 sites in Iowa from datasets with adequate meta-data
AERMOD “Field” Setup • Develop idealized representation of OC field studies
Receptor Field • Presented is a simple ratio of pollen deposition from source (adventituous) versus receptor fields over a 7 day period of pollen shed. • The line in the receptor field is the transect used for validation. Source Field
Validation of 8 fields OC is estimated by a simple ratio of adventitious versus receptor field pollen. With no major modification AERMOD predicts directionally correct, order of magnitude correspondence to field observations – Thus, with further calibration AERMOD can be adapted as a first tier model
Regional Modeling • Provide predictive and retrospective analyses of OC on a regional scale • Identify areas in Iowa that need more refined modeling and monitoring (first tier)
Link AERMOD with IEM • Configure a representative field setup based on the Ireland validation dataset. • Model is iterated over a 30km grid of points covering the state to produce an analysis • 4 runs are made for each point. The adventitious source field is rotated in 4 directions from the receptor field (N,E,S,W)
10 Jul 2006: Example Results • Outcrossing estimated at 1.8 meters into receptor field with 130 m isolation • Vectors are mid-afternoon winds Field to the East Field to the West
A work in progress... • Continue to test and refine AERMOD setup and post processing • Implement more advanced algorithms for local pollen competition/viability • Develop tools (online?) for others to use to access monitoring and response strategies.
All done, any questions? Daryl Herzmann akrherz@iastate.edu 3015 Agronomy 515.294.5978