Download
1 / 35
350 likes | 376 Views
Explore background slides from Meinshausen et al. (2015) on global mean temperature goals, self-set emission targets, and the need for diverse leadership. Learn about strategies to meet the 2°C target, such as country-specific ambitious goals and self-differentiation. Discover the necessary emissions reductions by 2025 and 2030 for a sustainable future. Analyze the current INDCs of major economies like the USA, EU28, and China, and their impact on global emission shares. Gain insights into global emission data and the measures needed for a climate-resilient world.

E N D
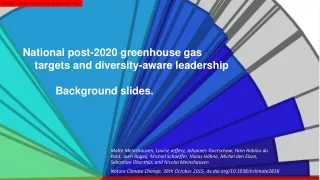
Embargo until 26th October 2015; 16:00 London Time National post-2020 greenhouse gas targets and diversity-aware leadership Background slides. Malte Meinshausen, Louise Jeffery, Johannes Guetschow, Yann Robiou du Pont, JoeriRogelj, Michiel Schaeffer, NiklasHöhne, Michel den Elzen, Sebastian Oberthür, and Nicolai Meinshausen Nature Climate Change, 26th October 2015, dx.doi.org/10.1038/nclimate2826
The problem • All countries agree to keep global mean temperatures at least below 2°C. • All the countries‘ self-set targets are 2°C compatible under their own understanding of fairness. • Adding up all countries‘ emissions, a least-cost path towards staying below 2°C will however be missed by a wide margin.
Meinshausen et al. 2015, Nature Climate Change, dx.doi.org/10.1038/nclimate2826
Meinshausen et al. 2015, Nature Climate Change, dx.doi.org/10.1038/nclimate2826
Meinshausen et al. 2015, Nature Climate Change, dx.doi.org/10.1038/nclimate2826
Meinshausen et al. 2015, Nature Climate Change, dx.doi.org/10.1038/nclimate2826
Meinshausen et al. 2015, Nature Climate Change, dx.doi.org/10.1038/nclimate2826
One solution • A major economy, say ‚country A‘, starts to lead in the international climate effort and sets an ambitious target. • All other countries adopt ‚comparable‘ targets to that country A. Comparable under their own understanding of fairness. • If the target of country A is sufficiently ambitious, a self-differentiation can then enable the collective 2°C target to be achieved.
Meinshausen et al. 2015, Nature Climate Change, dx.doi.org/10.1038/nclimate2826
Meinshausen et al. 2015, Nature Climate Change, dx.doi.org/10.1038/nclimate2826
Meinshausen et al. 2015, Nature Climate Change, dx.doi.org/10.1038/nclimate2826
Meinshausen et al. 2015, Nature Climate Change, dx.doi.org/10.1038/nclimate2826
What are 2°C compatible emissions? By 2025: • Lower global emissions to 15% below 2010, which is 10% above 1990 levels. By 2030: • Lower global emissions to 22% below 2010, which is 1990 levels. Those are approximately median values for any IPCC AR5 pathway that stays within the 1000 GtCO2 cumulative carbon budget limit. Methods see paper.
Fig. 1 in Meinshausen et al. 2015, Nature Climate Change, dx.doi.org/10.1038/nclimate2826
Fig. 1 in Meinshausen et al. 2015, Nature Climate Change, dx.doi.org/10.1038/nclimate2826
Fig. 1 in Meinshausen et al. 2015, Nature Climate Change, dx.doi.org/10.1038/nclimate2826
Fig. 1 in Meinshausen et al. 2015, Nature Climate Change, dx.doi.org/10.1038/nclimate2826
Fig. 1 in Meinshausen et al. 2015, Nature Climate Change, dx.doi.org/10.1038/nclimate2826
Current INDCs and leadership targets of USA, EU28 and China Global emission shares: • China accounts for a quarter of global emissions, 25%, in 2010. • Next biggest emitter was the USA with 16%. • EU28 comes in third with 11%. INDCs: • China‘s INDC is a ‚peaking by 2030‘ pledge combined with an intensity target, quantified at approximately 35% above 2010 emissions by 2030 • The INDC of the USA is a 26-28% reduction below 2005 by 2025. • The INDC of the EU28 is a 40% reduction below 1990 by 2030. Numbers use GWP.AR4 metric. excl. Landuse emissions. Fig. S3 in Meinshausen et al. 2015, Nature Climate Change, dx.doi.org/10.1038/nclimate2826 and Climatecollege.uniemelb.edu.au/indc-factsheets for per-capita emissions
48 Gt Meinshausen et al. 2015, Nature Climate Change, dx.doi.org/10.1038/nclimate2826 The pie represents global GHG emissions in 2010, incl. landuse. Colors correspond to the regions as indicated in the world map. Main emission data source is PRIMAP, a composite dataset combining UNFCCC official data, where available, CDIAC, EDGAR and other authoritative data sources.
48 Gt Meinshausen et al. 2015, Nature Climate Change, dx.doi.org/10.1038/nclimate2826 The pie represents global GHG emissions in 2010, incl. landuse. Colors correspond to the regions as indicated in the world map. Main emission data source is PRIMAP, a composite dataset combining UNFCCC official data, where available, CDIAC, EDGAR and other authoritative data sources.
48 Gt Meinshausen et al. 2015, Nature Climate Change, dx.doi.org/10.1038/nclimate2826 The pie represents global GHG emissions in 2010, incl. landuse. Colors correspond to the regions as indicated in the world map. Main emission data source is PRIMAP, a composite dataset combining UNFCCC official data, where available, CDIAC, EDGAR and other authoritative data sources.
48 Gt Meinshausen et al. 2015, Nature Climate Change, dx.doi.org/10.1038/nclimate2826
Meinshausen et al. 2015, Nature Climate Change, dx.doi.org/10.1038/nclimate2826
Meinshausen et al. 2015, Nature Climate Change, dx.doi.org/10.1038/nclimate2826 Percentages indicate changes of 2025 emissions (colored areas) relative to 2010 emissions (grey areas in background).
Meinshausen et al. 2015, Nature Climate Change, dx.doi.org/10.1038/nclimate2826 World emissions by 2025 would be 6% above 2010 levels, if other countries adopted ‚comparable‘ targets to the US. Comparability taken as the more favourable approach for every country.
Meinshausen et al. 2015, Nature Climate Change, dx.doi.org/10.1038/nclimate2826 If the USA were to adopt a target of -52% below its 2010 levels (54% below 2005), global emissions could be 15% below 2010, which is the 2°C waypoint.
Meinshausen et al. 2015, Nature Climate Change, dx.doi.org/10.1038/nclimate2826 By 2030, if every country ‚followed‘ Australia‘s target of 26-28% below 2005, then global emissions would be 2% above 2010 levels.
By 2030, Australia would have to reduce its emissions by 66% in order to act as leading by example, putting the world on a 2°C track.
Meinshausen et al. 2015, Nature Climate Change, dx.doi.org/10.1038/nclimate2826 By 2030, world emissions would be practically at 2010 levels, if all countries were to follow the 40% EU target (which is 27% below 2010).
Meinshausen et al. 2015, Nature Climate Change, dx.doi.org/10.1038/nclimate2826 By 2030, the EU28 would have to reduce 61% below 2010 or 67% below 1990, if the world should regard EU28 as a leader and be on a 2°C track.
Meinshausen et al. 2015, Nature Climate Change, dx.doi.org/10.1038/nclimate2826 If all countries were to follow China, with a supposedly 35% increase of emisisons until 2030 over 2010, then global emissions would increase by a third.
Meinshausen et al. 2015, Nature Climate Change, dx.doi.org/10.1038/nclimate2826 China would have to reduce its emissions by about a third, rather than increase by a third, in order to be a leading example for other countries and put the world on a 2°C track.
Meinshausen et al. 2015, Nature Climate Change, dx.doi.org/10.1038/nclimate2826
More information & interactive results at: www.mitigation-contributions.org An interactive data appendix with this study‘s results, allowing the user to probe any G20 country‘s target, if other world countries were doing ‚the same‘. The paper is available from 26th October 2015, 4pm London time: dx.doi.org/10.1038/nclimate2826