Download
1 / 42
420 likes | 535 Views
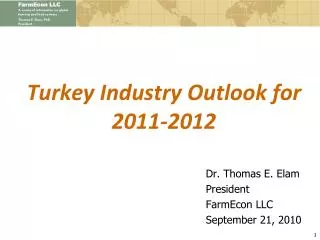
2012 Turkey and Protein Sector Outlook. Dr. Thomas E. Elam President FarmEcon LLC January 18, 2012. Overall Protein Market Drivers. $5.50-7.00 corn, $300-400 soybean meal Limited feed supplies Record-high meat and poultry exports Value, and Volume

E N D
2012 Turkey and Protein Sector Outlook Dr. Thomas E. Elam President FarmEcon LLC January 18, 2012
Overall Protein Market Drivers • $5.50-7.00 corn, $300-400 soybean meal • Limited feed supplies • Record-high meat and poultry exports • Value, and • Volume • Southwest drought, declining beef supply • Slow, but positive, domestic demand growth • All squeezing U.S. meat and poultry availability, and thus strong prices
Feed Cost Drivers: Corn and Soymeal(Futures prices current as of 1-126-2012)
Translated to HigherFeed Costs AND Volatility RFS 2 RFS 1
Feed Cost Drivers • Low U.S. grain stocks • Mediocre U.S. yields • Declining U.S. major crop acreage • Growing global demand • Increasing U.S. biofuels mandates • High crude oil and finished fuels prices • Hot/dry southern hemisphere weather
Protein wholesale prices relative to feed costs:A mixed bag of recent profitability trends
2012 Protein Production Outlook • Turkeys up 1-2% • Pork up 2-3%, export-driven • Beef down 4-5% – drought-driven • Milk up 1-2% • Broilers down 2-4% - 2011 financial losses • Wholesale prices for all likely to increase
Per Capita Meat DisappearanceFirst 3 4 5 Year Decline on Record
Why? • Continued tight feed supplies =Higher feed costs, lower availability =Need for higher product prices =Need to cut production • Perceived risks on feed costs • Record-high meat and poultry exports • 2008-2009 recession and lingering effects
2012 Summary Current pricing and low ending stocks imply modest 2012 turkey industry production growth. However, growth will be muted by continued high feed costs, and the need to recover those costs in wholesale pricing.
2012 Turkey Outlook Features • 1/1/2012 cold storage near record low 2011 level • Profitability supported by exports and pricing • Production: • Q1 2012: very near 2011 • Q2 2012: production +1% to +2% • Q3/Q4 2012: production also +1% to +2% • Flat or lower bird numbers, higher weights • Farbest adding 3 million birds, but not online until 2013 • Exports expected to decline slightly • Lower beef and broiler supply, higher prices • Feed costs remain the major wild card
FarmEcon Model: RTC Value Per Pound and Feed Costs Based on FarmEcon LLC model of 70% cut-up and 30% whole bird marketing mix. Prices are USDA/AMS. Does not include value-added products.
U.S. Market RTC Turkey Consumption(Per Capita) Unprofitable Profitable
Poult Placements, UB, Weekly,Point to Flat Q1 2012 Bird Numbers
Turkey Export TonnageRecord November Volume, 29% Annualized Gain Over 2009
Turkey Export ValueRecord Annual Value, 49% Annualized Gain over 2009
2012 Turkey Forecast Details(Production, Use and Stocks in Million Pounds)
2012 Protein Price ForecastsTurkey Gains Strength from Competing Meats
Major Risk Factors for 2012 • Acreage and weather • Southern hemisphere now • U.S. spring plantings and summer growing season • USDA reports that have more “surprises” • Grain and meat/poultry export demand • Ethanol mandate up 215 million bushels
Corn Price Model Forecast 2011/2012 Assumptions: Feedgrains Stocks/Use Ratio = 7.1% Ethanol Production = 13.7 Billion Gallons Ethanol Price = $2.65 per Gallon Predicted 2011/2012 average farm price received = $6.09 per bushel, and a new record-high
Despite record high crop prices and farm income our acreage is declining.
Blend Wall or Corn Wall? • E10 market is saturated • Requires 13 billion gallons of ethanol • We produced 14 billion gallons in 2011 • We exported 1 billion gallons • Why not sell more E85? • Ethanol BTUs are priced at 50% over gasoline • Parity is equal cost per BTU • Corn priced higher than energy parity • Why? The RFS is set too high
Corn/Soymeal Outlook – 2012 Cash corn prices remain at $5.50-$7.00, meal at $300-400, through March/April (basis Illinois cash markets) Upside risks on poor South America/Australia weather U.S. acreage, weather and demand drive Jun-Dec prices 2012 predicted corn acreage up, soybeans down Ethanol production will decline slightly (no tax credits) Slightly less DDGS production, and ethanol use mandate = increased corn demand Increasing ethanol and DDGS exports Energy prices are also critical to outlook High volatility in all feed ingredient prices likely
What Would 165 Bu. Corn Do? • Record 14.3 billion bushel crop • Make it possible to price corn for: • E85 sales • Higher feed use • More exports • Build stocks • Likely season average farm price $3.35-$4.00 • How likely, and is it repeatable?
What Would 145 Bu. Corn Do? • 12.6 billion bushel crop • 2012 crop = current use rate • No room to increase use • Higher 2013 RFS crowds out feeding and exports • Ethanol priced per gallon higher than gasoline • Likely season average farm price $7-$8 • How likely? About the same chance as 165
Summary: • Continued high, and volatile, feed costs • $5+ corn & $300+ soybean meal=new normal until a bumper corn crop • Feed cost volatility an ongoing issue • Four broiler company bankruptcies in 2011 • Increasing RFS, weather, and limited acreage are on a collision course • Another 2008 spike in the next 3-5 years?
What Needs to Happen? • RFS reform for conventional ethanol • Farm Bill reform to encourage acreage • Vigilance on the GIPSA/EPA/FDA fronts
Questions? Comments?