Download
1 / 40
420 likes | 808 Views
Understanding and Predicting Tropical Cyclone Risks for the Asia-Pacific Region. Johnny Chan. Guy Carpenter Asia-Pacific Climate Impact Centre City University of Hong Kong. Outline. Understanding Review of what you learned last year

E N D
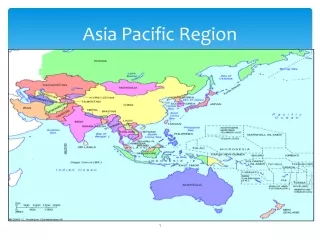
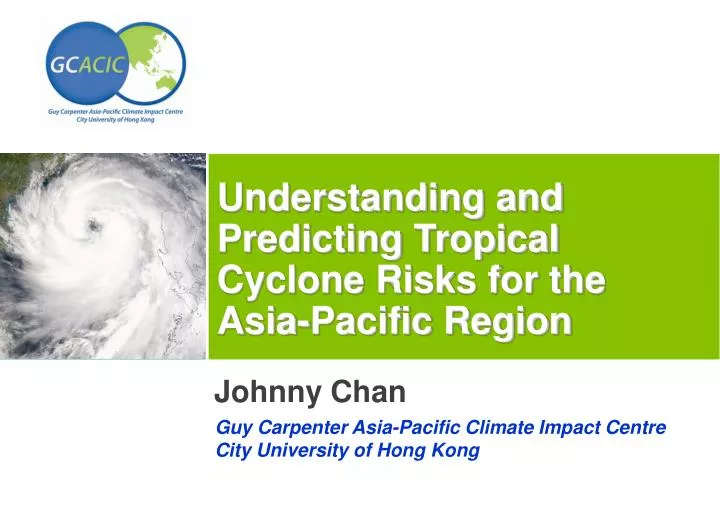
Understanding and Predicting Tropical Cyclone Risks for the Asia-Pacific Region Johnny Chan Guy Carpenter Asia-Pacific Climate Impact Centre City University of Hong Kong
Outline Understanding • Review of what you learned last year • Some new results in understanding global warming and tropical cyclone activity Prediction • Traditional method • New Approaches Summary
Adding a Custom Blue Color Value to FontsThe color is the same for both the white and grey templates Should you need to apply the custom blue color to a font,please do the following… Highlight the text you want to colorize and then go to the “Format” pull down menu to access the preferences for “Font”. Once the Font window appears, select the “Color” option and then choose “More Colors…” Under the “Custom” tab you will see value areas where you can type in the RGB values shown to the right. Once finished, click the “OK” button. This will apply the color to your highlighted type. Understanding (1)What you learned last year (R) Red = 0 (G) Green = 87 (B) Blue = 166
Variations of Landfall in Each Area at Various Oscillation Periods South China, Philippines and Vietnam standardized anomalies standardized anomalies East China standardized anomalies standardized anomalies Japan/Korea standardized anomalies standardized anomalies
1977-88 Patterns of TC occurrence anomalies TC occurrence anomalies Pattern 1 1964-76 Pattern 2 Pattern 3 1989-97
Summary • Tropical cyclone activities (frequency, intensity and track) in the western North Pacific Ocean do not follow the trend of global warming. • Instead, such activities oscillate with periods of one or more decades • Such variations or oscillations are caused by similar variations in the atmosphere and/or the ocean
Adding a Custom Blue Color Value to FontsThe color is the same for both the white and grey templates Should you need to apply the custom blue color to a font,please do the following… Highlight the text you want to colorize and then go to the “Format” pull down menu to access the preferences for “Font”. Once the Font window appears, select the “Color” option and then choose “More Colors…” Under the “Custom” tab you will see value areas where you can type in the RGB values shown to the right. Once finished, click the “OK” button. This will apply the color to your highlighted type. Understanding (2)Some New Results (R) Red = 0 (G) Green = 87 (B) Blue = 166
Background • Tropical cyclone formation and development depends on two sets of factors: • thermodynamic (heat energy and the “conduciveness” of the atmosphere to the development of strong convection) • dynamic (wind flow and degree of rotation)
Background • Thermodynamic conditions • ocean temperature • energy available for convection • atmospheric stability – “conduciveness” of atmosphere to the development of strong convection
Background • Dynamic conditions • extent of “cyclonic” rotation of the wind flow • vertical wind shear (wind at 15 km minus that at 1.5 km) – strong shear will tear off the vertical integrity of the cyclone
Background • Global warming leads to • an increase in the temperature near the earth’s surface (land and ocean) • an increase in the amount of water vapour in the atmosphere due to an increase in ocean temperature • No study has definitively demonstrated that the dynamic factors are modified by global warming (although some have suggested an increase in vertical wind shear).
Background • Due to global warming, the thermodynamic factors have become more favourable for tropical cyclone formation and development. • To determine whether global warming has an impact on the frequency of occurrence of tropical cyclones or of intense cyclones, we need to examine whether the thermodynamic factors are related to the variations on such frequencies. • A good proxy of the thermodynamic factors is the Maximum Potential Intensity (MPI)
Background • MPI = f(ocean temperature, outflow temperature, net amount of energy available for convection) • Because MPI gives the maximum possible intensity, a higher value of MPI summed over the ocean basin and over a season should imply a more thermodynamically energetic atmosphere, and more TCs could reach higher intensities a season with a higher value of MPI should have more intense TCs if the dominant control is thermodynamic
21-year running correlations with NCat45 Correlations with MPI
Summary • Thermodynamic control on the frequency of intense TCs is important only in the Atlantic • Estimating the effect of global warming on the frequency of intense TCs therefore must also assess such an effect on the dynamic processes.
Adding a Custom Blue Color Value to FontsThe color is the same for both the white and grey templates Should you need to apply the custom blue color to a font,please do the following… Highlight the text you want to colorize and then go to the “Format” pull down menu to access the preferences for “Font”. Once the Font window appears, select the “Color” option and then choose “More Colors…” Under the “Custom” tab you will see value areas where you can type in the RGB values shown to the right. Once finished, click the “OK” button. This will apply the color to your highlighted type. Prediction (1)Traditional Method (R) Red = 0 (G) Green = 87 (B) Blue = 166
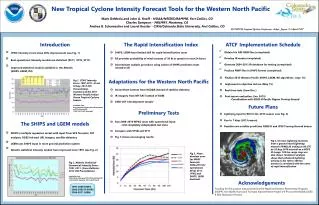
Statistical method • Identify a list of variables relating to the atmospheric and oceanographic conditions prior to the season that significantly correlate with seasonal tropical cyclone activity • Perform regressions to derive prediction equations
Examples of Predictors used in the CityU Forecasts • Index of the westward extent of the subtropical high over the western North Pacific • Index of the strength of the India-Burma trough (15-20oN, 80-120oE) • Primary mode of low-frequency variability over the North Pacific • Sea surface temperature (SST) anomalies in the NINO3.4 region (5oS-5oN,170-120oW) • Sea surface temperature (SST) anomalies in the NINO4 region (5oS-5oN, 160oE-150oW) • Equatorial Southern Oscillation Index (Equatorial SOI) • Equatorial Eastern Pacific SLP - Indonesia SLP (standardized anomalies)
Typhoons All tropical cyclones Tropical storms and typhoons Forecasts of Annual Tropical Cyclone Activity over the western North Pacific (Deviations from Observations)
Adding a Custom Blue Color Value to FontsThe color is the same for both the white and grey templates Should you need to apply the custom blue color to a font,please do the following… Highlight the text you want to colorize and then go to the “Format” pull down menu to access the preferences for “Font”. Once the Font window appears, select the “Color” option and then choose “More Colors…” Under the “Custom” tab you will see value areas where you can type in the RGB values shown to the right. Once finished, click the “OK” button. This will apply the color to your highlighted type. Prediction (2)Statistical Dynamical Method (R) Red = 0 (G) Green = 87 (B) Blue = 166
Statistical vs. Statistical-dynamical Methods Problem with the statistical method Relate the past events and future conditions by statistics Inherent problem assumes the future would behave the same as the past, which may not be correct Statistical-dynamical method partly solves the inherent problem by relating dynamical model predictions with future conditions Dynamical atmospheric model Predicted future conditions Integrate over time statistical prediction Observations statistical prediction # TCs Time several months
Tracks of EC landfalling TCs 1980 – 2001, Aug – Sept Subtropical High
GC Tracks of FL/GC landfalling TCs 1980 – 2001,Aug – Sept Subtropical High Subtropical High FL
Observed vs. PredictedEast Coast Single model: CERFACS Multimodel
Observed vs. PredictedGulf Coast Single model: LODYC Multimodel
Observed vs. PredictedFlorida Single model: LODYC Multimodel
Adding a Custom Blue Color Value to FontsThe color is the same for both the white and grey templates Should you need to apply the custom blue color to a font,please do the following… Highlight the text you want to colorize and then go to the “Format” pull down menu to access the preferences for “Font”. Once the Font window appears, select the “Color” option and then choose “More Colors…” Under the “Custom” tab you will see value areas where you can type in the RGB values shown to the right. Once finished, click the “OK” button. This will apply the color to your highlighted type. Prediction (3)Regional Climate Model (R) Red = 0 (G) Green = 87 (B) Blue = 166
Dynamical method • Run a global circulation model (GCM) with a relatively coarse resolution • Solutions from the GCM are used as boundary conditions for a regional model with a higher resolution that can “resolve” a tropical cyclone • Integrate the regional model to predict seasonal activity.
Summary • Statistical methods can provide some clues on tropical cyclone activity but suffers from an inherent problem of predicting future events based only on past conditions • Statistical-dynamical methods can provide predictive information and therefore should give better results, but still suffers from the statistical nature of the method. • Dynamical model forecasts should be the way forward to predict tropical cyclone risks although more research is still necessary on fine-tuning the regional model.