Download
1 / 39
390 likes | 955 Views
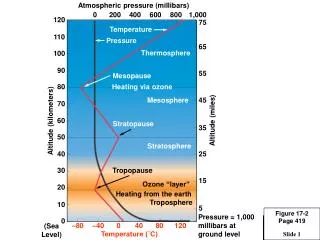
Figure 20-1 Page 433. Atmospheric pressure (millibars). Figure 20-2 Page 434. Temperature. Pressure. Mesopause. Stratopause. Tropopause. 0. 200. 400. 600. 800. 1,000. 120. 75. 110. 65. Thermosphere. 100. 90. 55. 80. Heating via ozone. Mesosphere. 45. 70. Altitude (miles).

E N D
Atmospheric pressure (millibars) Figure 20-2Page 434 Temperature Pressure Mesopause Stratopause Tropopause 0 200 400 600 800 1,000 120 75 110 65 Thermosphere 100 90 55 80 Heating via ozone Mesosphere 45 70 Altitude (miles) 60 Altitude (kilometers) 35 50 Stratosphere 40 25 30 15 Ozone “layer” 20 Heating from the earth Troposphere 10 5 Pressure = 1,000 millibars at ground level 0 –80 –40 0 40 80 120 (Sea Level) Temperature (˚C)
Figure 20-3Page 435 Photochemical ozone 40 25 35 20 Stratosphere 30 25 Stratospheric ozone 15 Altitude (kilometers) Altitude (miles) 20 10 15 10 5 Troposphere 5 0 0 0 5 10 15 20 Ozone concentration (ppm)
Table 20-1 Major Classes of Air Pollutants Class Carbon oxides Sulfur oxides Nitrogen oxides Volatile organic compounds (VOCs) Suspended particulate matter (SPM) Photochemical oxidants Radioactive substances Hazardous air pollutants (HAPs), which cause health effects such as cancer, birth defects, and nervous system problems Examples Carbon monoxide (CO) and carbon dioxide (CO2) Sulfur dioxide (SO2) and sulfur trioxide (SO3) Nitric oxide (NO), nitrogen dioxide (NO2), nitrous oxide (N2O) (NO and NO2 often are lumped together and labeled NOx) Methane (CH4), propane (C3H8), chlorofluorocarbons (CFCs) Solid particles (dust, soot, asbestos, lead, nitrate, and sulfate salts), liquid droplets (sulfuric acid, PCBs, dioxins, and pesticides) Ozone (O3), peroxyacyl nitrates (PANs), hydrogen peroxide (H2O2), aldehydes Radon-222, iodine-131, strontium-90, plutonium-239 (Table 3-1, p. 49) Carbon tetrachloride (CCl4), methyl chloride (CH3Cl), chloroform (CHCl3), benzene (C6H6), ethylene dibromide (C2H2Br2), formaldehyde (CH2O2) Table 20-1Page 436
Figure 20-4Page 436 2 – SO4 NO3 – Primary Pollutants CO CO2 Secondary Pollutants SO2 NO NO2 SO3 Most hydrocarbons HNO3 H2SO4 Most suspended particles H2O2 O3 PANs Most and salts Sources Natural Stationary Mobile
Table 20-2Page 438 Table 20-2 Major Outdoor Air Pollutants CARBON MONOXIDE (CO) Description: Colorless, odorless gas that is poisonous to air-breathing animals; forms during the incomplete combustion of carbon-containing fuels (2 C + O2 2 CO). Major human sources: Cigarette smoking (p. 409), incomplete burning of fossil fuels. About 77% (95% in cities)comes from motor vehicle exhaust. Health effects: Reacts with hemoglobin in red blood cells and reduces the ability of blood to bring oxygen to body cells and tissues. This impairs perception and thinking; slows reflexes; causes headaches, drowsiness, dizziness, and nausea; can trigger heart attacks and angina; damages the development of fetuses and young children; and aggravates chronic bronchitis, emphysema, and anemia. At high levels it causes collapse, coma, irreversible brain cell damage, and death.
Table 20-2Page 438 Table 20-2 Major Outdoor Air Pollutants NITROGEN DIOXIDE (NO2) Description: Reddish-brown irritating gas that gives photochemical smog its brownish color; in the atmosphere can be converted to nitric acid (HNO3), a major component of acid deposition. Major human sources: Fossil fuel burning in motor vehicles (49%) and power and industrial plants (49%). Health effects: Lung irritation and damage; aggravates asthma and chronic bronchitis; increases susceptibility to respiratory infections such as the flu and common colds (especially in young children and older adults). Environmental effects: Reduces visibility; acid deposition of HNO3 can damage trees, soils, and aquatic life in lakes. Property damage: HNO3 can corrode metals and eat away stone on buildings, statues, and monuments; NO2 can damage fabrics.
Table 20-2Page 438 Table 20-2 Major Outdoor Air Pollutants SULFUR DIOXIDE (SO2) Description: Colorless, irritating; forms mostly from the combustion of sulfur containing fossil fuels such as coal and oil (S + O2 SO2); in the atmosphere can be converted to sulfuric acid (H2SO4), a major component of acid deposition. Major human sources: Coal burning in power plants (88%) and industrial processes (10%). Health effects: Breathing problems for healthy people; restriction of airways in people with asthma; chronic exposure can cause a permanent condition similar to bronchitis. According to the WHO, at least 625 million people are exposed to unsafe levels of sulfur dioxide from fossil fuel burning. Environmental effects: Reduces visibility; acid deposition of H2SO4 can damage trees, soils, and aquatic life in lakes. Property damage: SO2 and H2SO4 can corrode metals and eat away stone on buildings, statues, and monuments; SO2 can damage paint, paper, and leather.
Table 20-2Page 438 Table 20-2 Major Outdoor Air Pollutants SUSPENDED PARTICULATE MATTER (SPM) Description: Variety of particles and droplets (aerosols) small and light enough to remain suspended in atmosphere for short periods (large particles) to long periods (small particles; Figure 20-6, p. 441); cause smoke, dust, and haze. Major human sources: Burning coal in power and industrial plants (40%), burning diesel and other fuels in vehicles (17%), agriculture (plowing, burning off fields), unpaved roads, construction. Health effects: Nose and throat irritation, lung damage, and bronchitis; aggravates bronchitis and asthma; shortens life; toxic particulates (such as lead, cadmium, PCBs, and dioxins) can cause mutations, reproductive problems, cancer. Environmental effects: Reduces visibility; acid deposition of H2SO4 droplets can damage trees, soils, and aquatic life in lakes. Property damage: Corrodes metal; soils and discolors buildings, clothes, fabrics, and paints.
Table 20-2Page 438 Table 20-2 Major Outdoor Air Pollutants OZONE (O3) Description: Highly reactive, irritating gas with an unpleasant odor that forms in the troposphere as a major component of photochemical smog (Figures 20-3 and 20-5). Major human sources: Chemical reaction with volatile organic compounds (VOCs, emitted mostly by cars and industries) and nitrogen oxides to form photochemical smog (Figure 20-5). Health effects: Breathing problems; coughing; eye, nose, and throat irritation; aggravates chronic diseases such as asthma, bronchitis, emphysema, and heart disease; reduces resistance to colds and pneumonia; may speed up lung tissue aging. Environmental effects: Ozone can damage plants and trees; smog can reduce visibility. Property damage: Damages rubber, fabrics, and paints.
Table 20-2Page 438 Table 20-2 Major Outdoor Air Pollutants LEAD Description: Solid toxic metal and its compounds, emitted into the atmosphere as particulate matter. Major human sources: Paint old houses), smelters (metal refineries), lead manufacture, storage batteries, leaded gasoline (being phased out in developed countries). Health effects: Accumulates in the body; brain and other nervous system damage and mental retardation (especially in children); digestive and other health problems; some lead-containing chemicals cause cancer in test animals. Environmental effects: Can harm wildlife.
Figure 20-5Page 440 Solar radiation Ultraviolet radiation NO Nitric oxide O2 Molecular oxygen NO2 Nitrogen dioxide H2O Water O Atomic oxygen Hydrocarbons PANs Peroxyacyl nitrates O3 Ozone Aldehydes (e.g., formaldehyde) HNO3 Nitric acid Photochemical smog
Ultrafine Particles Fine Particles Large Particles Figure 20-6Page 441 Sea salt nuclei Fly ash Carbon black Pollens Paint pigments Tobacco smoke Cement dust Milled flour Combustion nuclei Coal dust Oil smoke Metallurgical dust and fumes Photochemical smog Insecticide dusts 0.001 0.01 2.5 10.0 100.0 Average particle diameter (micrometers or microns)
Figure 20-7aPage 443 Increasing altitude Decreasing temperature Warmer air Inversion layer Cool layer Mountain Mountain Valley
Figure 20-7bPage 443 Descending warm air mass Sea breeze Increasing altitude Decreasing temperature Inversion layer Mountain range
Figure 20-8Page 444 Wind Transformation to sulfuric acid (H2SO4) and nitric acid (HNO3) Windborne ammonia gas and particles of cultivated soil partially neutralize acids and form dry sulfate and nitrate salts Wet acid deposition (droplets of H2SO4 and HNO3 dissolved in rain and snow) Nitric oxide (NO) Dry acid deposition (sulfur dioxide gas and particles of sulfate and nitrate salts) Sulfur dioxide (SO2) and NO Acid fog Farm Lakes in shallow soil low in limestone become acidic Ocean Lakes in deep soil high in limestone are buffered
Animation Acid deposition animation. Click to view animation.
Figure 20-10Page 446 Potential problem areas because of sensitive soils Potential problem areas because of air pollution: emissions leading to acid deposition Current problem areas (including lakes and rivers)
Figure 20-11Page 447 Emission Acid deposition SO2 H2O2 PANs NOX O3 Others Increased Susceptibility to drought, extreme cold, insects, mosses, and disease organisms Reduced photosynthesis and growth Direct damage to leaves and bark Soil acidification Tree death Reduced nutrient and water uptake Leaching of Soil nutrients Root damage Release of toxic metal icons Acid Groundwater
Solutions Figure 20-12Page 448 Acid Deposition Prevention Cleanup Reduce air pollution by improving energy efficiency Add lime to neutralize acidified lakes Reduce coal use Add phosphate fertilizer to neutralize acidified lakes Increase natural gas use Increase use of renewable resources Burn low-sulfur coal Remove SO2 particulates, and Nox from smokestack gases Remove Nox from motor vehicular exhaust Tax emissions of SO2
Figure 20-13Page 450 Para-dichlorobenzene Tetrachloroethylene Chloroform 1, 1, 1- Trichloroethane Formaldehyde Benzo-a-pyrene Nitrogen Oxides Styrene Tobacco Smoke Asbestos Radon-222 Methylene Chloride Carbon Monoxide
Figure 20-14Page 451 Outlet vents for furnaces and dryers Open window Open window Openings around pipes Openings around pipes Cracks in wall Cracks in wall Slab joints Wood stove Cracks in floor Sump pump Clothes dryer Furnace Slab Radon-222 gas Uranium-238 Soil
Figure 20-15aPage 452 Nasal cavity Oral cavity Pharynx (throat) (see figure 20.15b) Trachea (windpipe) Bronchus Right lung Bronchioles (see figure 20.15c)
Figure 20-15bPage 452 Epithelial cell Cilia Mucus
Figure 2-15cPage 452 Bronchiole Alveolar sac (sectioned) Alveolar duct Alveoli
Figure 20-17Page 456 Solutions Stationery Source Air Pollution Dispersion or Cleanup Prevention Burn low-sulfur coal Disperse emissions above thermal inversion layer with tall smokestacks Remove sulfur from coal Convert coal to a liquid or gaseous fuel Remove pollutants after combustion Shift to less polluting fuels Tax each unit of pollution produced
Figure 20-18aPage 457 Cleaned gas Electrodes Dust discharge Dirty gas Electrostatic Precipitator
Figure 20-18bPage 457 Bags Cleaned gas Dirty gas Baghouse Filter Dust discharge
Figure 20-18cPage 457 Cleaned gas Dirty gas Cyclone Separator Dust discharge
Figure 20-18dPage 457 Cleaned gas Dirty gas Wet gas Clean water Dirty water Wet Scrubber
Figure 20-19Page 458 Solutions Motor Vehicle Pollutions Prevention Cleanup Mass transit Emission control devices Bicycles and walking Less polluting engines Less polluting fuels Car exhaust Inspections twice a year Improve fuel efficiency Get older, polluting cars off the road Give buyers tax write- offs for buying low- polluting, energy- efficient vehicles Restrict driving in polluted areas Stricter emission standards
Figure 20-20Page 459 Solutions Indoor Air Pollution Prevention Cleanup Cover ceiling tiles and lining of AC ducts to prevent release of mineral fibers Use adjustable fresh air vents for work spaces Increase intake of outside air Ban smoking or limit it to well-ventilated areas Change air more frequently Set stricter formaldehyde emissions standards for carpet, furniture, and building materials Circulate building’s air through rooftop greenhouses Prevent radon infiltration Use exhaust hoods for stoves and appliances burning natural gas Use office machines in well-ventilated areas Use less polluting substitutes for harmful cleaning agents, paints, and other products Install efficient chimneys for wood-burning stoves
Figure 20-21Page 459 Solutions Air Pollution Prevention Cleanup Improve energy efficiency to reduce fossil fuel use Reduce poverty Distribute cheap and efficient cookstoves to poor families in developing countries Rely more on lower-polluting natural gas Rely more on renewable energy (especially solar cells, wind, and solar-produced hydrogen) Reduce or ban indoor smoking Develop simple and cheap test for indoor pollutants such as particulates, radon, and formaldehyde Transfer technologies for latest energy efficiency, renewable energy, and pollution prevention to developing countries.
Figure 20-21Page 459 What Can You Do? Indoor Air Pollution • Test for radon and formaldehyde inside your home and take corrective measures as needed. • Do not buy furniture and other products containing formaldehyde. • Remove your shoes before entering your house to reduce inputs of dust, lead, and pesticides. • Test your house or workplace for asbestos fiber levels and for any crumbling asbestos materials if it was built before 1980. • Don't live in a pre-1980 house without having its indoor air tested for asbestos and lead. • Do not store gasoline, solvents, or other volatile hazardous chemicals inside a home or attached garage. • If you smoke, do it outside or in a closed room vented to the outside. • Make sure that wood-burning stoves, fireplaces, and kerosene- and gas-burning heaters are properly installed, vented, and maintained. • Install carbon monoxide detectors in all sleeping areas.
Present range Future range Overlap Figure 12-12 Page 264
Animation Effect of air pollution in forests animation. Click to view animation.
Animation Acid deposition animation. Click to view animation.
Animation Thermal inversion animation. Click to view animation.