Download
1 / 27
290 likes | 502 Views
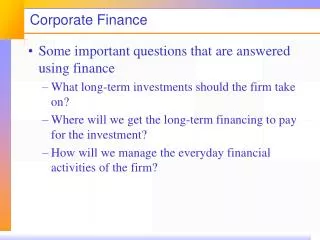
Corporate Valuation and Financing Exercises Session 2 « From accounting to FCF » Laurent Frisque - laurent.frisque@gmail.com Steve Plasman – steve.plasman@gmail.com. Q1 various investment opportunities in various sectors.

E N D
Corporate Valuation and FinancingExercises Session 2« From accounting to FCF» Laurent Frisque - laurent.frisque@gmail.com Steve Plasman – steve.plasman@gmail.com
Q1 various investment opportunities in various sectors ‘working capital requirement’, ‘net working capital’, ‘operating cash-flows’, ‘cash flows’ from investment’ : apply those concepts Q1: various investment opportunities in various sectors • Insight into the cash generation capabilities of the potential targets.
Q1 various investment opportunities in various sectors • The targeted company has the following features: • Yeart-1 EPS: 1.50€ • Depreciationt-1: 0.30€ (per share) • CAPEXt-1: 0.80€ (per share) • WCR: 0.20 € (per share) • Expected yearly growth for the next 5 Y: 15% After 5Y • LT earnings growth: 5% • WCR stable @5% • CAPEX = depreciation • Targeted debt ratio, : 30% (the company always issues enough new debt to fund any required principal repayments and finances its capital needs at a target debt ratio ) • attractive tax incentive, pays no tax.
Q1 various investment opportunities in various sectors A) You are asked to present the company’s FCF to equity holders for the years t to t+6. The current targeted debt ratio is 30% Funding by equity: 1- = 70% • FCF = NI + DEPRECIATION – AQ (CAPEX) – D WCR
Q1 various investment opportunities in various sectors • Given • OK?
Q1 various investment opportunities in various sectors • Part of the investments funded by Equity (AQ)
Q1 various investment opportunities in various sectors • Part of the working Capital Requirement funded by Equity
Q1 various investment opportunities in various sectors • FCF = NI + DEPRECIATION – AQ (CAPEX) – D WCR
FCF = NI + DEPRECIATION – AQ – D WCR Alternative solution: FCF = DIV – DK + D Cash D Cash = Q1 various investment opportunities in various sectors
B) The current targeted is 30% what would be the impact on the FCFE if the company decides to enjoy a flattening yield curve ride and increase its leverage? Q1 various investment opportunities in various sectors • The FCFE increases as the financing needs will be funded by extra debt.
C) A DDM valuation could potentially lead to the same valuation as a FCFE valuation and if so in what situations? Q1 various investment opportunities in various sectors • YES if all the FCFE is distributed as dividend • or • if part of the FCFE is reinvested in the company but in 0 NPV projects.
Q2 investing in other sectors. • A consumer electronics company, Nokin. The company’s statements show that in 2010 (in ‘000 €) : • Revenues: 10.000 • Net earnings: 1.750 • CAPEX: 3.000 • DEPR: 2.000 • Interest charge: 500 • WCR: 15% of sales • Revenues growth next 3Y: 10% • Long term growth 5% • Targeted debt ratio : 15% • Tax rate, Tc: 50% • EBIT, Capex and depreciation follow the revenues growth.
Q2 • A) How much Free Cash Flows will be generated by this company the next 4Years (2011-2014) ?
Q2 B) 2 intriguing elements in the Nokin’s annual reports : Do you believe you should let Mitchell know as these elements could impact your previous analysis? The 2010 figures include a charge to face a potential lawsuit by Nonac who claims Nokin stole some IP. This charge is (hopefully) a onetime 100,000€ for the lawsuit which is expected to start in 2013. This amount has been paid to Mac & Mac their law firm.
Q2 B) 2 intriguing elements in the Nokin’s annual reports : Years ago Nokin acquired a Korean start-up. The price paid at the time represented a significant premium to the book value which created a goodwill on Nokin’s B/S. After a careful review it appears the technology was not that great and the board has decided to write-off the goodwill in order to reflect the value loss. This creates a 1,000,000 amortisation charge in 2010. • Non cash item ! • Should be added back in 2010 • Depreciation (& amortisation) should be 3.000 (instead of 2.000) • in 2011 3000 x 1,1 = 3,300 (i.e. 'the depreciation line' will increase every year)
Q3 ‘THE PROJECT’ • The seller, wants to get rid of its retail activities. • It is a very thin margin business where the cash cycle is very important: the working capital needs to be optimised. • Following the well-known rule ‘if you can’t convince them confuse them’ the bankers have provided Eddy and Mitchell with plenty of data:
Q3 • A) Turn the accounting balance sheet into a summarized managerial balance sheet. reveal the capital you employ and the net assets. • FA + WCR + Cash = SE + D • Working Capital Requirement- WCR: Trade Rec + Inventories - Account payables
Q3 B) Compute the Net Working Capital and check its evolution over 2010 and 2011. Has the company done a good job? What went potentially wrong? NWC = Current Assets – Curent Liabilities NWC = SE + Lt Debt – FA NWC = WCR + Net liquid balance (ST Inv + Cash – ST Debt)
Q3 B) Compute the Net Working Capital and check its evolution over 2010 and 2011. Has the company done a good job? What went potentially wrong? The working capital requirement has increased by 146% over 2011 ! Looking at the details, inventories have massively increased while accounts payable have decreased --> it seems suppliers want their cash faster.
Q3 C) Provide a cash-flow statement for 2011. direct and indirect methodologies (NI+Dep - D WCR) – (AQ) + (DK + D D – DIV) = D Cash
Q3 C) Provide a cash-flow statement for 2011. direct and indirect methodologies
Q3 D) Assess the FCF. Goal is to steadily acquire a majority stake in the open market before offering a squeeze out. what is the relevant FCF to compute in 2011? At this stage BHHC wants to acquire en equity piece -> the focus is on the Free cash flows of all Equity firm (FCFE)
Q3 E) Relevant to present a single year FCF?
Q3 • F) Industry wide profitability analysis: Industry wide average EBIT margin of 5.84% and an EBITDA margin of 7.91%. How does ‘THE PROJECT’ company compare to those benchmarks in 2011? How do you interpret the comparison?
Q3 G) Merits of the EBTIDA measure to assess the cash generation capabilities of a company. Any comment you could share with them taking into account your recent work on ‘THE PROJECT’ ?