Download
1 / 46
460 likes | 491 Views
Explore modeling human count data and fault-tolerant models for urban analysis using sensor data in a large-scale urban traffic study. Learn from over 100 million measurements from 1716 sensors.

E N D
Probabilistic Analysis of a Large-Scale Urban Traffic Sensor Data SetJon Hutchins, Alexander Ihler, and Padhraic SmythDepartment of Computer ScienceUniversity of California, Irvine
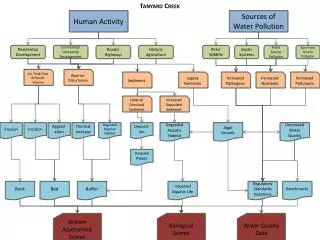
Human Activity Sensors Pe MS People Counter – Optical Sensor Car Counter – Loop Detector
Outline • Modeling human count data • Scale-Up challenges • Fault-tolerant model • Urban Analysis
Outline • Modeling human count data • Scale-Up challenges • Fault-tolerant model • Urban Analysis
Outline • Modeling human count data • Scale-Up challenges • Fault-tolerant model • Urban Analysis
Outline • Modeling human count data • Scale-Up challenges • Fault-tolerant model • Urban Analysis
One Week of Freeway Observations car count
One Week of Freeway Observations car count
One Week of Freeway Observations car count
One Week of Freeway Observations car count Sensor location
Original Model hidden observed Observed Count
Original Model hidden observed Poisson Rate λ(t) Normal Count Observed Count
Original Model hidden observed Poisson Rate λ(t) Normal Count Observed Count Event Count Event State
Original Model hidden observed Poisson Rate λ(t) Normal Count Observed Count Event Count OBSERVED COUNT NORMAL COUNT (UNOBSERVED) EVENT COUNT (UNOBSERVED) Event State Markov with Poisson counts Time-varying Poisson
Original Model hidden observed Poisson Rate λ(t) Normal Count Observed Count Event Count OBSERVED COUNT NORMAL COUNT (UNOBSERVED) EVENT COUNT (UNOBSERVED) Event State Markov with Poisson counts Time-varying Poisson Markov Modulated Poisson Process (MMPP) e.g., see Scott (1998)
hidden Inference over Time observed Poisson Rate λ(t) Poisson Rate λ(t) Poisson Rate λ(t) Normal Count Normal Count Normal Count Observed Count Observed Count Observed Count Event Count Event Count Event Count Event State Event State Event State Time t-1 Time t Time t+1
Learning and Inference • Bayesian Framework • Gibbs sampling to approximate parameters and hidden variables • Forward-backward algorithm • Complexity • Linear in the number of time slices For Details see Ihler, Hutchins, Smyth ACM TKDD (Dec 2007)
Urban Scale-Up Sensor Locations Map of study area 1716 sensors + 7 months = over 100 million measurements
Urban Scale-Up Difficult Sensors to Analyze see Bickel et al. Statistical Science (2007)
Urban Scale-Up – Original Model car count p(E)
Urban Scale-Up - Challenges car count p(E)
Periods of clear periodic behavior missed by our model Long periods of sensor failure
Fault-Tolerant Model hidden Original Model observed Poisson Rate λ(t) Poisson Rate λ(t) Poisson Rate λ(t) Normal Count Normal Count Normal Count Observed Count Observed Count Observed Count Event Count Event Count Event Count Event State Event State Event State Fault State Fault State Fault State Time t-1 Time t Time t+1
Unusual activity detection as a function of day of week and time of day
Spatial Event 16:30
16:30 16:55 16:40 17:20 17:25 17:05 17:50 18:05 18:20
Model prediction of normal flow Raw flow measurements
Model prediction of normal flow Raw flow measurements
Conclusions • Extended our earlier work to add a fault-tolerant component • Our new model automatically learned normal and anomalous behavior for over 1700 sensors and 100 million measurements • This approach has made possible analysis of a large-scale urban traffic sensor data set that was previously considered beyond analysis