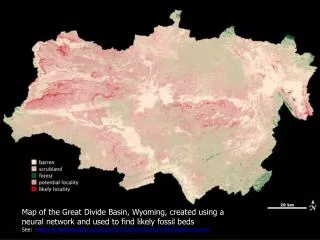
Supervised Classification in Imagine
Supervised Classification in Imagine . D. Meyer dmeyer@usgs.gov E. Wood woodec@usgs.gov. Concept: Supervised Classification. The goal of this exercise is to use the spectral signatures of different land covers to create a supervised classification.


Supervised Classification in Imagine
E N D
Presentation Transcript
Supervised Classification in Imagine D. Meyer dmeyer@usgs.gov E. Wood woodec@usgs.gov
Concept: Supervised Classification • The goal of this exercise is to use the spectral signatures of different land covers to create a supervised classification. • We will attempt to map the same land cover classes covered in the last exercise.
Geospatial data fundamentals • Geospatial information types: • Raster: “images” composed of “pixels” • Vector: points, lines, polygons (“shapes”) • Raster data types: • Continuous • Single attribute (panchormatic = “black & white”) • Multiple attribute (multi-spectral = “color”) • Discrete: • Quantized continuous • Categorical
Continuous vs. Categorical • “Feature space” – set of all attributes describing an object. • Student feature space: • Height (continuous) • Weight (continuous) • Hair color (weirdly continuous) • SSN (categorical) -doesn’t make sense to take an “average” SSN • GIS attributes • Continuous – How warm? How bright? How much photosynthesis? What’s the mean population density? Crime rate per 100,000? • Discrete – what type of land cover? In which country is it located?
RGB: decomposing images RGB red green blue
RGB: spectral signatures Very bright Bright Kinda bright Medium Kinda dark Dark Very dark Red Green Blue
Supervised Classification • Very widely used method of extracting thematic information • Use multispectral (and other) information • Separate different land cover classes based on spectral response, texture, …. • i.e. separability in “feature space”
Supervised classification • Want to separate clusters in feature space • E.g. 2 channels of information • Are all clusters separate?
Tools • Identify spectral signatures of different land cover types using tools within Imagine: • Signature editor • Alarm feature • Signature editor statistics • Areas of interest (AOI’s) • AOI tool • Supervised classifier (“maximum likelihood”) • Raster Attribute Editor
Supervised Landsat Classification • Open “germtm.img” from the data folder (RGB=5,4,3)
AOI tool • Open AOI -> AOI Tool • Open AOI -> create polygons around training sites
Signature Editor • Have the Classification menu open • Utility -> inquire box and locate given x,y coordinates
Classify the image • The goal of this exercise is to use the spectral signatures collected in the previous to classify the reflectance image: germtm.img (open this in a viewer, r,g,b->5,4,3) • Open the previous AOI for germtm.img from the “spectral signatures” exercise. In the viewer menu bar: File-> Open-> AOI Layer to see the training polygons.
Classify the image • In the Imagine Toolbar, click on the “ Classifier” button to get the Classifier menu; click on “Supervised Classification”
Classify the Image • Input file: “germtm.img” • Signature file: “germtm.sig” (from before) • Output file: “germtm_sup.img” (in results folder for the current exercise) • Parametric rule: Maximum Likelihood. • Click “Okay”
Classify the image • Open classified image in the same viewer as the input image (deselect “clear display”) • Select the “Arrange Layers” icon in the Viewer and move the AOI layer to the bottom to hide the polygons (“Apply”).
Classify the image • Swipe between the input and classified image. Move around and swipe between different areas to observe the results.
Refine the classification • From the viewer window, select Raster->Attributes
Refine Classification • In the raster attributes editor, click column properties icon to edit the location and size of the columns in the editor. • Move the “Class Names” column heading to the “top” and change it’s wide to 10 (makes it leftmost column). • Move the “color” heading “up” just below “Class Names”
Refine Classification • Make various “classes” red to evaluate it’s accuracy (good urban classification)
Refine Classification • Make various “classes” red to evaluate it’s accuracy (questionable urban classification)
Refine the classification • One solution: delete the problem class in the signature file (iterate for all classes). • Rerun classification with updated signatures.
Compare to Unsupervised classification • Open “xiso.img” from the previous exercise (DO NOT CLEAR DISPLAY • Use swipe to make a quantitiative comparison with germtm_sup.img • Using the raster attributes editor, compute the number of pixels in each class for both the unsupervised and supervised classification