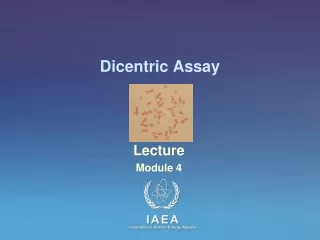
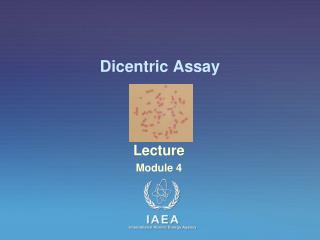
Dicentric Assay
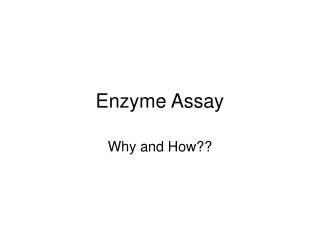
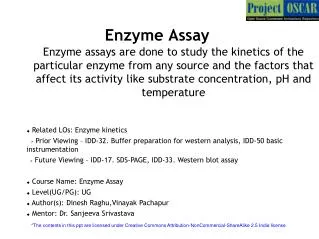
Dicentric Assay. Lecture Module 4. Dose response curves (1). 250 kVp X-rays. Neutron mean energies, MeV. 2.0. 0.7. 7.6. 14.7. 1 Gy min -1. 1.5. Dicentrics per cell. 0.5 Gy min -1. 1.0. 0.2 Gy h -1. 0.18 Gy h -1. 0.5. 60 Co g -rays. 0.0. 0. 1. 2. 3. 4. 5. Dose, Gy.

Dicentric Assay
E N D
Presentation Transcript
Dicentric Assay Lecture Module 4
Dose response curves (1) 250 kVp X-rays Neutron mean energies, MeV 2.0 0.7 7.6 14.7 1 Gy min-1 1.5 Dicentrics per cell 0.5 Gy min-1 1.0 0.2 Gy h-1 0.18 Gy h-1 0.5 60Co g-rays 0.0 0 1 2 3 4 5 Dose, Gy 15772
Dose response curves (2) Which radiations to use ?
Dose response curves (3) Each lab should produce its own calibration curves; do not use other’s • Background control • What doses to use ? • How many data points ? • How many cells to score ? • How many donors to use?
Cell culture (1) • Need to score first metaphases (M1) • 48h to complete first cell cycle • Choose a medium that is not too fast growth • Use PHA for mitogenic stimulation • Monitor cell cycling with FPG staining
Cell culture (2) Two basic methods: • Whole blood culture • Separated lymphocyte culture
Cell culture (4) Fixation This is a simple procedure Basic steps: • Harvest cells from culture • Swell cells by hypotonic salt solution • Fix cells in alcohol : acetic acid mixture • Wash several times in fixative to remove non-metaphase cell debris
Slide making Essential points • Clean, grease-free slides • Cold, wet slides • Laboratory ambient temperature and humidity • Adjust concentration of metaphases
Pre-treatment Prior to staining • Clean up the background cloudiness • Brief wash in an RNAse A solution – full protocol is given in the IAEA Manual
Slide staining Fluorescence plus Giemsa stain (FPG) • Essential to ensure M1 scoring Giemsa stain • If confirmed that there are no M2 cells present • If using early Colcemid culture method
Slide scoring Two methods: • Conventional by-eye • Automated microscope assistance
Scoring at the microscope The old way The new way
How many cells to score for overdose case ? Essential points • Depends on dicentric frequency • Depends on the statistical uncertainties needed • Depends on urgency for result • Depends on available skilled scorers • Depends on availability of a metaphase finder
95% confidence limits on 500 or 1000 cells scored Dose estimate Confidence No of cells scored (mGy) limits 5001000 100 Upper 320 245 Lower <0 16 250 Upper 448 380 Lower 111 141 500 Upper 677 627 Lower 333 383 1000 Upper 1178 1127 Lower 830 881
Data recording (1) The count of objects must balance A metaphase with: A dicentric plus its fragment still = 46 A centric ring plus its fragment = 47 Each excess acentric increases the count above 46 by +1 Tri-, quadri- centricsetc, are converted to dicentric equivalents
Data recording (2) Use a standard score sheet • The sheet should include scorer and case ID • Full retrieval of the observations on each cell
Information storage Securely preserve • Data sheets • Slides • Surplus fixed cells • Case file notes
How to present the dose estimate (1) • Read the dose off the appropriate dose response curve • This is easy • Calculate the statistical uncertainties on the dose estimate • This is a little more difficult • Report the result to the doctor or patient • This can be difficult: do they understand statistics?
How to present the dose estimate (4) Which method to use? In practice, in most cases the first and simpler method is sufficient
How to present the dose estimate (5) • Does the ‘customer’ – understand what is a confidence limit? • The biodosimetry laboratory has to be prepared to explain the result and put it into simple comprehensible terms. Not easy!
How to present the dose estimate (6) At low doses • If the lower 95% confidence limit is negative it can be ignored and only the upper limit is of concern • Consider presenting the result graphically as a probability distribution
How to present the dose estimate (8) Presenting the dose as an odds ratio • This also applies to low, possibly zero, dose events • It needs two sources of information: A dose estimate from e.g., a badge A dose estimate from dicentrics • Which is correct?
How to present the dose estimate (9) Odds ratio • Badge = 66 mSv • Dicentrics = 1 in 1000 cells (background?) • Dicentrics = zero dose with UCL = 100 mGy • Consider 2 possibilities: zero or 66 mSv • Odds ratio 4.5 : 1.0 in favour of zero dose • Easy for a patient to understand
Conclusions This lecture has covered the dicentric assay from the aspects of: • Producing dose response curves • Processing the lymphocytes • Making and scoring the slides • Presenting the dose estimates in a way that can be understood by non-scientists