Download
1 / 6
60 likes | 229 Views
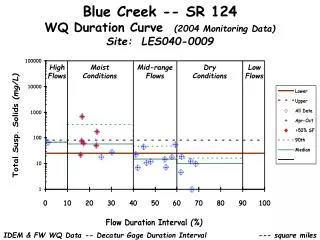
Blue Creek -- SR 124 WQ Duration Curve (2004 Monitoring Data) Site: LES040-0009. High Flows. Moist Conditions. Mid-range Flows. Dry Conditions. Low Flows. IDEM & FW WQ Data -- Decatur Gage Duration Interval. --- square miles.

E N D
Blue Creek -- SR 124WQ Duration Curve (2004 Monitoring Data)Site: LES040-0009 High Flows Moist Conditions Mid-range Flows Dry Conditions Low Flows IDEM & FW WQ Data -- Decatur Gage Duration Interval --- square miles
Blue Creek -- SR 124WQ Duration Curve (2004 Monitoring Data)Site: LES040-0007 High Flows Moist Conditions Mid-range Flows Dry Conditions Low Flows IDEM & FW WQ Data -- Decatur Gage Duration Interval --- square miles
Blue Creek -- SR 124Load Duration Curve (2004 Monitoring Data)Site: LES040-0009 High Flows Moist Conditions Mid-range Flows Dry Conditions Low Flows IDEM+FW Data & Gage 03324000 / 04182590 Duration Interval 79.6 square miles
Yellow Creek -- CR 250 SLoad Duration Curve (2004 Monitoring Data)Site: LES040-0038 High Flows Moist Conditions Mid-range Flows Dry Conditions Low Flows IDEM+FW Data & Gage 03324000 / 04182590 Duration Interval 24.5 square miles
Yellow Creek -- CR 250 SWQ Duration Curve (2004 Monitoring Data)Site: LES040-0038 High Flows Moist Conditions Mid-range Flows Dry Conditions Low Flows IDEM & FW WQ Data -- Decatur Gage Duration Interval --- square miles
Yellow Creek -- CR 250 SLoad Duration Curve (2004 Monitoring Data)Site: LES040-0038 High Flows Moist Conditions Mid-range Flows Dry Conditions Low Flows IDEM+FW Data & Gage 03324000 / 04182590 Duration Interval 24.5 square miles