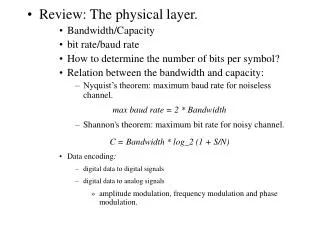
Capacity Utilization Rate
Capacity Utilization Rate. International Workshop on Industrial Statistics Dalian, China. June 21-25, 2010. David McDowell. Outline. Definitions Uses High level demonstration and discussion of some approaches Details Survey Hodrick-Prescott Filter (HP) Capital stock.

Capacity Utilization Rate
E N D
Presentation Transcript
Capacity Utilization Rate International Workshop on Industrial Statistics Dalian, China June 21-25, 2010 David McDowell
Outline • Definitions • Uses • High level demonstration and discussion of some approaches • Details • Survey • Hodrick-Prescott Filter (HP) • Capital stock Statistics Canada • Statistique Canada
Definition: Capacity Utilization RateFormula Statistics Canada • Statistique Canada
Definition: Capacity Utilization RateCapacity Output • Capacity output as a concept • Variously linked to economic theories, of the firm, the macro economy (output gap) and price levels Statistics Canada • Statistique Canada
Definition: Capacity OutputExamples • Generally capacity is meant to measure the output that can be produced with the available stock of capital. This output depends on how other inputs and technology are combined • The essential idea is that capacity is the aspect of output that co-varies with the capital stock over the long-run. Statistics Canada • Statistique Canada
Definition: Capacity Output Examples • Potential output is associated with the full utilization of all factors of production. Often associated with short run cost curves and with fixed capital alone – capacity is defined as the most efficient level of operation of existing stock. • Potential output is an estimate of full-employment GDP, or the level of GDP attainable when the economy is operating at a high rate of resource use. Statistics Canada • Statistique Canada
Definition: Capacity Output Examples • “Potential output measures the productive capacity of the economy. It is a measure of sustainable output, in which the intensity of resource use is neither adding to nor subtracting from inflationary pressure.” Statistics Canada • Statistique Canada
Definition: Capacity Output Examples • Potential output is the maximum output an economy can sustain without generating inflationary pressures • Potential output is the level of output that results when the rates of capacity utilization are “normal”, labour input is at natural rate of unemployment and productivity is at trend level Statistics Canada • Statistique Canada
Uses: Capacity Utilization • It is considered a significant determinant of future investment in plant and equipment • May be used in forecast models of growth and investment • It is often considered as part of the analysis of cost and price pressures Statistics Canada • Statistique Canada
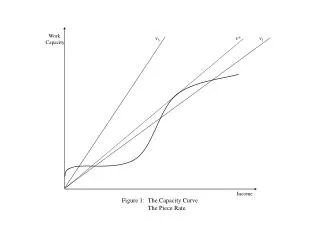
Approaches to Measuring Capacity Output • Generally capacity output, in many of the definitions, is not directly observable • Various approaches are used: • Through the peaks (Wharton School) • Trend GDP and GDP/Capital approaches • Hodrick-Prescott - HP- (or other trend methods) • Production function models • Surveys • Combinations of above Statistics Canada • Statistique Canada
Through the peaks GDP Statistics Canada • Statistique Canada
Through the peaks Output/Capital Statistics Canada • Statistique Canada
HP Method Wood Industry 1991Q1capital/output ratio Statistics Canada • Statistique Canada
Survey benchmarks Statistics Canada • Statistique Canada
Survey Results The first column indicates the industry, the second column contains the capacity estimate, the third column gives the coefficient of variation and the last two columns provide the lower and upper boundaries of the 95% confidence interval for each estimate. Industry Capacity use coeffvar Lower Upper E311XXX 75.89 0.033 70.95 80.82 E3121XX 61.24 0.019 59.01 63.46 E3122XX 75.58 0.001 75.37 75.78 E312XXX 62.12 0.017 60.07 64.18 E313XXX 72.84 0.035 67.83 77.86 E314XXX 69.19 0.032 64.79 73.58 E315XXX 67.84 0.044 62.06 73.63 E316XXX 49.16 0.083 41.19 57.13 E321XXX 68.10 0.047 61.80 74.40 E322XXX 81.09 0.031 76.20 85.99 E323XXX 70.51 0.038 65.27 75.75 E324XXX 77.04 0.047 69.95 84.13 E325XXX 72.04 0.037 66.82 77.26 E3261XX 64.84 0.029 61.13 68.56 E3262XX 66.03 0.007 65.16 66.91 Statistics Canada • Statistique Canada
Survey Results Industryrate size 99ExxxxXX 902311684 Industry estimate 70 99ExxxxXX 801594484 bounds 69.56 to 70.19 99ExxxxXX 501366031 99ExxxxXX 42603762 99ExxxXX 60523000 99ExxxxXX 85407441 99ExxxxXX 80150841 99ExxxxXX 83120000 99ExxxxXX 72111933 99ExxxxXX 80104470 99ExxxxXX 90102317 99ExxxxXX 7084624 99ExxxxXX 5081119 99ExxxxXX 3063766 99ExxxxXX 7060994 99ExxxxXX 8048527 99ExxxxXX 4045609 99ExxxxXX 10024272 99ExxxxXX 5023022 99ExxxxXX 9020272 Statistics Canada • Statistique Canada
Capacity Utilization RatesActual Data Statistics Canada • Statistique Canada
Summary STC Practice • STC produces a measure of capacity use for goods-producing industries less agriculture • Current Methods • Quarterly stocks by interpolation and projection • Survey based rates • Manufacturing and Electric Power • Hodrick-Prescott Filter approach • Logging and Forestry; Mining and Oil and Gas Extraction; Construction Statistics Canada • Statistique Canada
Capital Expenditure Survey Program • Annual Survey of Capital Expenditure • Preliminary and Intentions Survey • Actual Survey • Preliminary 2009 and Intentions 2010 • Conducted November 2009 to January 2010 • Actual 2008 • Conducted April to September 2009 and is available • Actual 2009 is underway at this time Statistics Canada • Statistique Canada
Earliest Test Version Question Business Conditions Survey of Manufacturing Capacity use in the last quarter was . . . .? This rate was: • Higher than Normal • About Normal • Below Normal Statistics Canada • Statistique Canada
Current Question • 1987 added to capital expenditure survey • 1989 follow-up quality assessment of survey results • 1991 comparative analysis of results with survey alternative • 1992 introduce survey indicator and HP method Statistics Canada • Statistique Canada
Capacity Use Question For yyyy, this plant has been operating at what percentage of its capacity? …………………%_______________. Capacity is defined as maximum production attainable under normal conditions. With regard to normal conditions, please follow the company’s operating practice with respect to the use of productive facilities, overtime, work-shifts, holidays, etc. When any of your facilities permit the substitution of one product for another, use a product mix at capacity which is most similar to the composition of your yyyy output. Statistics Canada • Statistique Canada
Survey Guide: Capacity Use • Capacity use (utilization) is calculated by taking the actual production level for an establishment (production can be measure in dollars or units) and dividing it by the establishment’s capacity production level. • Capacity production is defined as maximum production attainable under normal conditions. • To calculate capacity production, follow the establishment’s operating practices with respect to the use of productive facilities, overtime, work-shifts, holidays, etc. For example, if your plant normally operates with one shift of eight hours a day five days a week, then capacity will be calculated subject to these conditions and not on the hypothetical case of three shifts a day, seven days a week. Statistics Canada • Statistique Canada
Reasons for operating at less than capacity If this plant has been operating at less than capacity during yyyy, what is the principal reason? (Please check the appropriate box). Insufficient orders Insufficient labour available Lack of materials or supplies Strike or work stoppage Plant shutdown (e.g. upgrading,equipment failure) Startup of new operation Sufficient inventory on hand Other reasons - specify Statistics Canada • Statistique Canada
Reasons for operating at more than capacity • If this plant has been operating at more than capacity during yyyy, • what is the principal reason? (Please check the appropriate box). • Stronger demand for product • Insufficient inventory on hand • Other reasons – specify • Has the production capacity of this plant changed in yyyy? • Increased Decreased No change Statistics Canada • Statistique Canada
Survey Quality Control • Link changes in capacity use to changes in output and investment • Compare preliminary answer to revised • Verification of large changes • Other data and sources Statistics Canada • Statistique Canada
Quarterly Estimates • STC Time Series Generalized Benchmarking System • The capital stock is projected and interpolated monthly using spline trend done on 5 year moving interval • Practically this means projected (hyperbolic) stock changes slightly as move from benchmark estimate • Combined with estimates of K$GDP used to interpolate/project capacity use with Quadratic minimization between benchmarks • The quarter-to-quarter movement of the benchmarked series is kept as close as possible to that of the original quarterly series. • The benchmarked series satisfies the annual benchmark values. Statistics Canada • Statistique Canada
The Hodrick-Prescott Filter • Bank of Canada Technical Report no. 59 “A simple Multivariate Filter for Measurement of Potential Output” By Douglas Laxton and Robert Tetlow • HP filter derives the trend of a series • Subject to a smoothness constraint that penalizes variations in the growth of the trend • Requires judgement for: smoothness, level, anchor points • Currently used where survey estimates are not available Statistics Canada • Statistique Canada
Related information • As the above example illustrates, the mechanical application of a detrending technique to capital productivity data is just the first step in the estimation of capacity utilization rates. Ultimately, capacity utilization estimates must be consistent with the other indicators of market tightness that are available. The agreed methodology makes use of the indicators listed next to calibrate the capacity utilization estimates. Statistics Canada • Statistique Canada
Summary and use of Related information • Coverage: • non-farm goods producing industries • Data: • output: GDP at factor cost • capital stocks: net hyperbolic or delayed depreciation • quarterly interpolation and projection of capital stocks: • Non Manufacturing Trend method: • • Hodrick-Prescott univariate filter • Indicators: • Annual surveyed capacity utilization rates compiled by Statistics Canada • Physical capacity utilization rates calculated from industry data covering the following industries: electric power, natural gas distribution; crude petroleum; natural gas; paper and alliedproducts; primary metals; chemicals; petroleum and coal • Persons-hours worked relative to trend • Electricity consumption relative to trend • Energy consumption relative to trend • U.S. capacity utilization rates Statistics Canada • Statistique Canada
Effect of Revised Stock • Survey Method • No effect on benchmark levels • Possible effect on trend • Hodrick-Prescott Filter • Require recalibration of height • Overall trend could change Statistics Canada • Statistique Canada
Perpetual Inventory Method Statistics Canada • Statistique Canada
Annual Rates of Depreciation10 year life Statistics Canada • Statistique Canada
Forms of DepreciationRemaining Value Statistics Canada • Statistique Canada