Download
1 / 32
340 likes | 842 Views
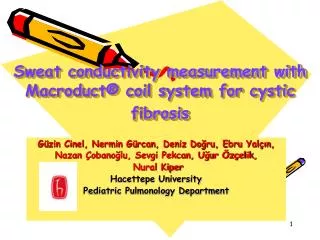
Sweat conductivity measurement with Macroduct® coil system for cystic fibrosis. Güzin Cinel, Nermin Gürcan, Deniz Doğru, Ebru Yalçın, Nazan Çobanoğlu, Sevgi Pekcan, Uğur Özçelik, Nural Kiper Hacettepe University Pediatric Pulmonology Department . CYSTIC FIBROSIS.

E N D
Sweat conductivity measurement withMacroduct® coil system for cystic fibrosis Güzin Cinel, Nermin Gürcan, Deniz Doğru, Ebru Yalçın, Nazan Çobanoğlu, Sevgi Pekcan, Uğur Özçelik, Nural Kiper Hacettepe University Pediatric Pulmonology Department
CYSTIC FIBROSIS • The most common lethal hereditary disease seen in Caucasians • Autosomal recessive • Gene clonned in 1989 • The gene is mapped to chromosome 7q31 and encodes a protein called CFTR • More than 1500 mutations
CFTR • cAMP-regulated chloride channel on the apical membrane of epithelial cells • Regulates sodium and chloride flow on the cell surface • Disfunction leads to -impaired sodium and chloride reabsorbtion on sweat ducts -impaired chloride secretion on respiratory epithelia, increased Na absorbtion because of the effects on the epithelial Na channel -Chloride channel on the pancreatic duct; important activity on bicarbonate secretion
CF • Upper respiratory tract, lungs, sweat glands, intestines, hepatobilliary system, pancreas, genitourinary system • Lung disease has the greatest impact on morbidity and mortality • Affects more than one system; so many clinical manifestations • Sometimes diagnosis can be difficult
American CF Foundation Diagnosis Criteria (1998) • Presence of one or more characteristic phenotypic features • or a history of CF in a sibling • or a positive newborn screening test result • And laboratory evidence of aCFTR abnormality as documented by *elevated sweat chloride concentration *or identification of mutations in each CFTR gene known to cause CF *or abnormal nasal potential difference
Sweat Test-1 • In most cases, the diagnosis of CF is confirmed by demonstrating elevated chloride concentration in sweat (>60 mmol/L) • Old adage from Northern European folklore: “Woe to that child which when kissed on the forehead tastes salty. He is bewitched and soon must die.”
Sweat test-2 • 1948- devastating heat wave in New York City; hospitals saw a disproportionate number of children with CF who had become dehydrated from losing excessive salt in their sweat • 1953-Darling, Di Sant’ Agnese, Perera et al.: Elevated salt in the sweat of CF patients; the basic pathology is in exocrine glands • 1959- Gibson and Cooke: Sweat electrolite measurements with pilocarpine iontophoresis technique and the values of CF patients
Gibson Cooke Technique • A gauze pad moistened with pilocarpine is applied to the volar surface of the forearm • Sweating is stimulated by applying 3mA current on it for five minutes • A weighed gauze pad is located on this area after iontophoresis and is covered with a parafilm • After waiting 30 minutes for sweat collection, gauze pad is re-weighed and chloride concentration is measured with titration • At least 100 mg sweat is needed for analysis
Sweat chloride concentration; • <40 mEq/L is normal and the probability to be CF is very low • >60 mEq/L is consistent with the diagnosis of CF, but the result must be interpreted in the context of the patient’s age and clinical picture • Between 40 and 60 mEq/L is suggestive of CF but not diagnostic
To diagnose CF with QPIT Patient with • one or more clinical manifestations related with CF phenotype OR • a history of CF in a sibling *sweat chloride concentration must be >60 mEq/Lat two different times
Disadvantages of Gibson Cooke Technique-1 • Fully trained, experienced,well-informed operatorsare needed • Involves multiple steps for collection and analysis of the sweat sample, is cumbersome to perform • Involves risk of volumetric, gravimetric, condensate and evaporation errors, especially in laboratories that do not perform sweat testing routinely
Disadvantages of Gibson Cooke Technique-2 Time and skill are required • to prevent evaporation during collection • to determine sweat weight with a chemical balance • to calculate the chemical composition of the eluted sample So, new methods are developed for sweat collection and analysis
Conductivity measurement with Macroduct® coil system-1 • Two electrodes carrying pilocarpine containing disks are placed on the volar surface of the forearm for iontophoretic stimulation • Max 1.5 mA current is applied on these electrodes for 5 minutes • To collect sweat, “Macroduct® collector” (a spiral plastic tube) is placed on the area where the positive electrode moved
Conductivity measurement with Macroduct® coil system-2 • As collected sweat is retained in this plastic tube, dead space or evaporation risk does not take place • The amount of the sweat can be seen at any time of the collection • 50-60 μL sweat can be collected in 30 minutes; enough for measurement of chloride titration, osmolality and conductivity on the same specimen
3120 Sweat Check Sweat Conductivity Analyzer® • Measures electrical conductivity of the sweat sample • Continious flow principle • Capable of measuring the conductivity of a sweat specimen of 6-10 microliters • Conductivity is determined as mmol/L; representing the molar concentration of a sodium chloride solution equivalent in conductivity to that of the sample
Studies about sweat conductivity measurement-1 • Barben et al*. *In 21 CF patient and 85 control group sweat chloride concentration and osmolality were measured with“macroduct collection” *30 microliters sweat was required for both measurements *CF was diagnosed ifchloride concentration is above 60 mmol/L and osmolality is above 200 mmol/kg *Barben J, Ammann RA, Metlagel A, Schoeni MH. Conductivity determined by a new sweat analyzer compared with chloride concentrations for the diagnosis of cystic fibrosis. J Pediatr 2005;146:183-8.
Studies about sweat conductivity measurement-2 • Conductivity was measured from the other arm • Mean conductivity values 36±1.0 mmol/L in healthy subjects 115±2.8 mmol/L in CF subjects • Both tests applied to 94 patients and conductivity identified all CF patients and differentiated them from healthy subjects (sensitivity and specificity 100%)
Studies about sweat conductivity measurement-3 • Conductivity measurement *requires less sweat sample *takes shorter time • %97 of the subjects and parents, respectively, preferred the new sweat test mainly because the result was available quickly • When 80 mmol/Lwas used as proposed cut off value they found neither false positive nor false negative results • They suggested that conductivity measurement could be used as a diagnostic test in addition to screening
Studies about sweat conductivity measurement-4 Hammond et al*. • Compared conductivity measurement after “macro collection” with quantitative pilocarpine iontophoresis test in 1090 patients for 10 years • “Macro collection” system and conductivity measured by Sweat Check analyzer was as effective as measurement of sweat chloride concentration to differentiate CF and normal subjects *Hamond KB, Nelson L, Gibson LE. Clinical evaluation of the macroduct sweat collection system and conductivity analyzer in the diagnosis of cystic fibrosis. J Pediatr 1994; 124:255-60.
Studies about sweat conductivity measurement-5 Lezana et al*. • 3834 subjects in 10 yearswith Sweat Check analyzer • In 294 CF patients, median conductivity value 111 mmol/L (82-148) • In normal subjects 36 mmol/L (12-89) • The best cut-off value for CF diagnosis was ≥90 mmol/L (sensitivity %99.7, specificity %100) • To exclude CF diagnosis, the best cut-off value was 75 mol/L *Lezana JL, Vargas MH, Karam-Bechara J, Aldana RS, Furuya MEY. Sweat conductivity and choride titration for cystic fibrosis diagnosis in 3834 subjects. Journal of Cystic Fibrosis 2003;2: 1-7.
Aims: • To determine sensitivity and specificity of conductivity measurement using Macroduct Sweat Check Sweat Conductivity Analyzer® for CF diagnosis • To assess the cut-off values of conductivity measurements of our patients for CF diagnosis and exclusion • To assess the reliability of conductivity measurement for CF diagnosis; so this simple and rapid test can be used widespread for CF diagnosis
Method-1 • Between June 2005 and February 2006, in Hacettepe University Pediatric Pulmonology Department • Patients with CF diagnosis • Elevated sweat chloride concentration but do not have clinical findings of CF • Control group from subjects followed in our department and known as not CF Compared the results of sweat chloride concentration withGibson Cooke Technique and conductivity measurement with Macroduct coil system
For sweat collection, QPIT is applied with Gibson Cooke Technique on the right arm and Macroduct coil system on the left arm at the same time Chloride concentration is measured from the sample collected with Gibson Cooke Technique Conductivity is measured from the sample collected with Macroduct® coil system Method-2
Results-2 • The relation between chloride concentration and conductivity measurements in CF and non-CF patients is seen in this graphic • According to this scatter graphic, the frequency of conductivity values in CF and non-CF groups discriminates both population
Results-3 • With Spearman correlation test, when all measurements evaluated together, there is a positive, strong and significant relationship between chloride concentration and conductivity r=%89 p<0.001 Conductivity (mmol/L) groups non CF CF Chloride concentration (mEq/L)
Results-4 • In CF group, there is a positive, weak and significant relationship between two methods r=%34; p=0.012 • In non-CF group there is a positive, moderate and significant relationship between two methods r=%69; p<0.001 Conductivity (mmol/L) groups non CF CF Chloride concentration (mEq/L)
Results-5 • The capability of conductivity measurement to discriminate CF and non-CF patients is determined by “ROC curve” • The area under curve is %99.6; p<0.001 • The large area under the curve demonstrates that the conductivity method is closely matched the chloride concentration
Results-6 • The best cut-off value for CF diagnosis is ≥90 mmol/L (sensitivity %92.9, specificity %100, PPV %100, NPV %94.4, kappa=0.934) PPV: Positive predictive value, NPV: Negative predictive value, *best cut-off value
Results-7 • The best cut-off value to exclude CF is <70 mmol/L (sensitivity %93.4, specificity %92.1, PPV %91.9, NPV %93.5, kappa=0.855)
Conclusion-1 • Conductivity measurement of sweat collected with Macroduct coil system is successful to discriminate CF and non-CF patients With conductivity measurement, • we determined the best cut-off value for CF diagnosis as 90 mmol/L, • and the best cut-off value for exclusion of CF is 70 mmol/L
Conclusion-2 • Easy to apply, minimizes the technical errors; so can be used widespread as a screening test • Conductivity values cannot be used for accurate diagnosis yet, so for every positive test results, chloride concentration should be measured