Download
1 / 24
240 likes | 268 Views
Explore the utilization of IPv6 addresses, address capacity challenges, current allocation policies, and future address demands in this comprehensive report from the ARIN XV IPv6 Roundtable presented by Geoff Huston. Gain insights into address efficiency, global subscriber statistics, network populations, and the implications for long-term address sustainability.

E N D
Where did all those IPv6 addresses go? A Report from the ARIN XV IPv6 Roundtable Geoff Huston (APNIC) With thanks to Thomas Narten and David Conrad for some of the material presented here @Ripe 50 – May 2005
It seems rather odd… • To be considering address capacity issues in a technology that is really only ramping up. • 128 bits allows an awesomely large pool of unique values “If the earth were made entirely out of 1 cubic millimetre grains of sand, then you could give a unique address to each grain in 300 million planets the size of the earth” -- Wikipedia • This is a highly speculative exercise….
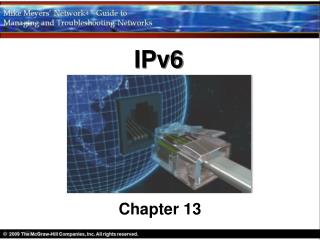
IETF IPv6 Address Structure /64 64 - n bits n bits 64 bits Global ID Subnet ID Interface ID RIR IPv6 Address Structure 48 bits 16 bits 64 bits Global ID Subnet ID Interface ID
Current Address Allocation Policies • RIR to ISP(LIR): • Initial allocation: /32 (minimum) • Subsequent allocation : /32 (minimum) • ISP(LIR) to customer: • Only 1 interface ever: /128 • Only 1 subnet ever: /64 • Everything else: /48 (minimum) • ISP(LIR) to each POP: • /48 This IPv6 address plan is defined in RFC 3177 (Sept 2001) “this decision may be taken in the knowledge that there is objectively no shortage of /48s”
Address Efficiency – HD=0.8 Prefix /48 count end-site count /32 65,536 7,132 /31 131,072 12,417 /30 262,144 21,619 /29 524,288 37,641 /28 1,048,576 65,536 /27 2,097,152 114,105 /26 4,194,304 198,668 /25 8,388,608 345,901 /24 16,777,216 602,249 /23 33,554,432 1,048,576 /22 67,108,864 1,825,677 /21 134,217,728 3,178,688 /20 268,435,456 5,534,417 /19 536,870,912 9,635,980 /18 1,073,741,824 16,777,216
Google (“subscribers millions”) • Broadband • 150 million total globally • 85 million DSL Globally • 12 million in US today • 58 million in US in 2008 • Cellular • Cingular: 50 million • Verizon: 43 million • Korea: 37 million • Russia: 20 million • Asia: 560 million • China: 580 million subscribers by 2009
Squeezing in Bigger Numbers for Longer Timeframes • The demand - global populations: • Households, Workplaces, Devices, Manufacturers, Public agencies • Thousands of service enterprises serving millions of end sites in commodity communications services • Addressing technology to last for at least tens of decades • Total end-site populations of tens of billions of end sites i.e. the total is order (1011 - 1012) ? • The supply – inter-domain routing • We really may be stuck with BGP • Approx 200,000 routing (RIB) entries today • A billion routing (RIB) entries looks a little too optimistic i.e. a total entry count is order (107) ? • The shoe horn • Aggregation and hierarchies in the address plan
Putting it together • Aggregation and hierarchies are not highly efficient addressing structures • The addressing plan needs to accommodate both large and small • The addressing plan needs to be simple • That implies: (16 bit subnets) + (HD = 0.8) + (global populations) + (60 years) =?
HD Ratio for Bigger Networks Prefix /48 count end-site count /21 134,217,728 3,178,688 /20 268,435,456 5,534,417 /19 536,870,912 9,635,980 /18 1,073,741,824 16,777,216 /17 2,147,483,648 29,210,830 /16 4,294,967,296 50,859,008 /15 8,589,934,592 88,550,677 /14 17,179,869,184 154,175,683 /13 34,359,738,368 268,435,456 /12 68,719,476,736 467,373,275 /11 137,438,953,472 813,744,135 /10 274,877,906,944 1,416,810,831 /9 549,755,813,888 2,466,810,934 /8 1,099,511,627,776 4,294,967,296 /7 2,199,023,255,552 7,477,972,398 /6 4,398,046,511,104 13,019,906,166 /5 8,796,093,022,208 22,668,973,294 /4 17,592,186,044,416 39,468,974,941 /3 35,184,372,088,832 68,719,476,736 /2 70,368,744,177,664 119,647,558,364 /1 140,737,488,355,328 208,318,498,661
Multiplying it out A possible consumption total: a simple address plan (/48s) x aggregation factor (HD = 0.8) x global populations (10**11) x 60 years time frame = 50 billion – 200 billion = /1 -- /4 range RFC 3177: estimated 178 billion global IDs with a higher HD ratio. The total “comfortable” address capacity was a /3.
Is this enough of a margin? /4 consumption • A total of 1/16 of the of the available IPv6 address space /1 consumption • A total of 1/2 of the available IPv6 address space Factors / Uncertainties: • Time period estimates (decades vs centuries) • Consumption models (recyclable vs one-time manufacture) • Network models (single domain vs overlays) • Network Service models (value-add-service vs commodity distribution) • Device service models (discrete devices vs ubiquitous embedding) • Population counts (human populations vs device populations) • Address Distribution models (cohesive uniform policies vs diverse supply streams) • Overall utilization efficiency models (aggregated commodity supply chains vs specialized markets)
If this is looking slightly uncomfortable… then we need to re-look at the basic assumptions to see where there may be some room to shift the allocation and/or architectural parameters to obtain some additional expansion space
Where’s the Wriggle Room? • IPv6 Allocation Policies • The HD-Ratio target for address utilization • The subnet field size used for end-site allocation • IPv6 Address Architecture • 64 bit Interface ID 48 bits 16 bits 64 bits Global ID Subnet ID Interface ID
1. The HD Ratio RFC 1715: “It is also interesting to note that if we devote 80 bits to the "network" and use 48 bits for "server less autoconfiguration", we can number more than E.11 networks” The current IPv6 address plan allows for only 48 bits to the “network” and still has the E.11 networks objective
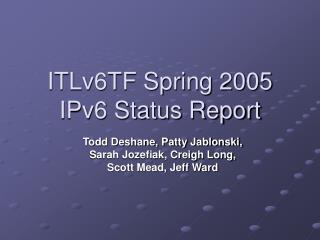
1. Varying the HD Ratio /32 /20 0.98 51.4% Utilization Efficiency 31.2% 0.96 0.94 10.9% 0.90 2.1% 0.80 Prefix Size
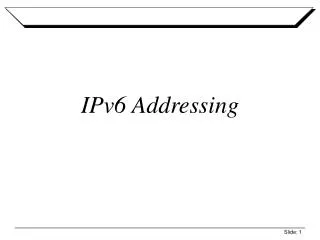
Comparison of prefix size distributions from V6 registry simulations
Observations • 80% of all allocations are /31, /32 for HD ratio of 0.8 or higher • Changing the HD ratio will not impact most allocations in a steady state registry function • Only 2% of all allocations are larger than a /27 • For these larger allocations the target efficiency is lifted from 4% to 25% by changing the HD Ratio from 0.8 to 0.94 • Total 3 year address consumption is reduced by a factor of 10 in changing the HD ratio from 0.8 to 0.94
What is a “good” HD Ratio to use? • Consider what is common practice in today’s network in terms of internal architecture • APNIC is conducting a survey of ISPs in the region on network structure and internal levels of address hierarchy and will present the findings at APNIC 20 • Define a common ‘baseline’ efficiency level rather than an average attainable level • What value would be readily achievable by large and small networks without resorting to renumbering or unacceptable internal route fragmentation? • Consider overall longer term objectives • Anticipated address pool lifetime • Anticipated impact on the routing space
2. The Subnet Identifier field RFC 3177: The subnet field Recommendation • /48 in the general case, except for very large subscribers • /64 when it is known that one and only one subnet is needed by design • /128 when it is absolutely known that one and only one device is connecting Motivation • reduce evaluation and record-keeping workload in the address distribution function • ease of renumbering the provider prefix • ease of multi-homing • end-site growth • allows end-sites to maintain a single reverse mapping domain • Allows sites to maintain a common reverse mapping zone for multiple prefixes • Conformity with site-local structure (now unique locals)
Alternatives for subnetting • Re-Consider /56 SOHO default size • Maintain /128 and /64 allocation points, and /48 for compound enterprise end-sites • Processing and record-keeping overheads are a consideration here • End-site growth models for SOHO are not looking at extensive subnetting of a single provider realm • Renumbering workload is unaltered • Multi-homing is not looking at prefix rewriting • Fixed points maintains ease of reverse mapping zone maintenance functions • This would allow for overall 6 – 7 bits of reduced total address consumption
Alternatives for subnetting • Consider variable length subnetting • Allows for greater end-site address utilization efficiencies • Implies higher cost for evaluation and record keeping functions • Implies tradeoff between utilization efficiency and growth overheads • Likely strong pressure to simplify the process by adopting the maximal value of the range
3. The Interface Identifier • This 64 bit identifier-size was defined in the address architecture for V6 for auto-configuration and potential endpoint identity use • There is little prospect for use of this field as a unique, stable global endpoint identity • Considerations for change here have implications in terms of overlayed service infrastructure of auto-configuration and various network discovery operations
Where’s the Wriggle Room? The HD ratio • If using HD = 0.8 consumes 1 block of address space • Using HD = 0.87 consumes 1/2 as much space • Using HD = 0.94 consumes 1/10 as much space • i.e. moving to a higher HD ratio will recover up to 3 bits here The subnet field • /56 SOHO default subnet size may alter cumulative total by 6 - 7 bits /10 -- /17 total consumption given original demand estimates Is this sufficient margin for error / uncertainty in the initial assumptions about the deployment lifetime for IPv6?
Public Policy - The “Fairness” Factor • When should one adjust allocation policies for global public resources? • Early • Uniformly (conservative) outcomes across spectrum of demand, without late adopter penalties. • Later • Disparate outcomes with early adopter rewards (e.g. Class A legacy in IPv4) RFC 3177 (again): We are highly confident in the validity of this analysis, based on experience with IPv4 and several other address spaces, and on extremely ambitious scaling goals for the Internet amounting to an 80 bit address space *per person*. Even so, being acutely aware of the history of under-estimating demand, the IETF has reserved more than 85% of the address space (i.e., the bulk of the space not under the 001 Global Unicast Address prefix). Therefore, if the analysis does one day turn out to be wrong,our successors will still have the option of imposing much more restrictive allocation policies on the remaining 85%. However, we must stress that vendors should not encode any of the boundaries discussed here either in software nor hardware. Under that assumption, should we ever have to use the remaining 85% of the address space, such a migration may not be devoid of pain, but it should be far less disruptive than deployment of a new version of IP.