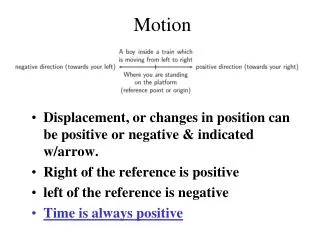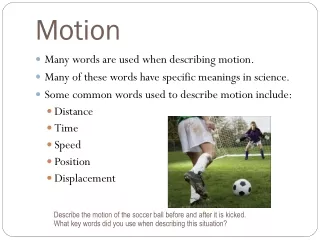
Motion
Learn about uniform motion concept, average speed calculations, and graphing skills for motion analysis. Discover how to identify independent and dependent variables, slope calculation, best fit lines, and interpolating on distance-time graphs.


Motion
E N D
Presentation Transcript
B1.1 Motion
Uniform Motion Motion occurs when an imaginary line joining an object to a reference point changes in length, direction or both The term uniform motion describes an object that moves at a constant rate in the same direction. True uniform motion is nearly impossible to maintain in real life situations due to forces such as friction, wind resistance etc...
Average Speed t = 1.2 s 5.0 m The car moved a distance of 5.0 m in a time of 1.2 s. It did not exhibit uniform motion because it sped up and slowed down. The average speed of the car is defined as a change in distance during a time interval. vavg = average speed (m/s) Δd = distance travelled (m) Δt = time elapsed (s) The Δ is the greek letter delta and means “change in.”
examples: Practice Problems p. 128 1) A huge ocean wave, or tsunami, travels a distance of 4.0 x 10⁶ m in 3.6 x 10⁴ s. Calculate the average speed of the tsunami. 1.1 x 10² m/s 2) A Concorde airplane could fly at an average speed of 694 m/s. Calculate how long it would have taken the Concorde to fly around the world, which is approximately 4.00 x 10⁷ m. 5.76 x 10⁴ s 3) An electric train is traveling at an average speed of 6.9 m/s for 4.0 s. Calculate the distance traveled by the train. 28 m
Independent Variable The independent variable is also called the manipulated variable. It is the one that the experimenter changes, or has control over. It is always plotted on the horizontal, or x-axis. When looking at a data table, the independent variable will be seen to increase by regular intervals.
Dependent Variable The dependent variable is also called the responding variable. It is the one that the experimenter measures. It’s value depends on the independent variable. It changes in response to the change that the experimenter makes to the manipulated variable. It is always plotted on the vertical, or y-axis. When looking at a data table, the dependent variable will NOT be seen to increase by regular intervals.
For example, to determine the density of a liquid, a student measures the mass of various volumes of the liquid. Volume is the independent variable because the experimenter set it, and it increases by regular intervals. Mass is the dependent variable because the experimenter measured it and it does not increase by regular intervals.
All graphs MUST have a title, of the y vs x format. units label label units Each axis must have the appropriate label and the symbol (abbreviation) for the units, in brackets. Each point that you place on the graph must be circled.
Defining Slope Slope (m) measures the amount of steepness of a given line segment. Slope may be defined as the vertical change (rise) divided by the horizontal change (run). slope = m
Pick any two points on the graph. Label the points as (x,y) Substitute the values into the slope formula. ALWAYS include units!
Lines with a positive slope rise to the right. Lines with a negative slope fall to the right. Horizontal lines have a slope of zero. ∆y = zero no vertical change! Verticallines have an infinite slope. ∆x = zero no horizontal change!
Best Fit Line Ifthere is a clear pattern among the points, draw a best fit line that comes as close as possible to most of the points. Best fit line may be straight or curved. (m) (N)
Distance-Time Graphs A motorboat is traveling at a constant speed. A person on the shore is recording the distance the boat travels away from the first marker buoy every 2.0 s. A distance vs time graph can be plotted to analyze the motion of the boat. Distance vs Time Distance (m) text p.129 Time (s)
Distance vs Time change in distance slope Distance (m) change in time average speed = Time (s) The slope of a line on a distance-time graph is equal to the average speed of the object.
Distance vs Time Distance (m) = 5.0 m/s Time (s) (0,0) Disco Stu sez: (6.0,30) Don’t forget to round to the right number of sig digs, baby! So, the boat is moving at a constant rate of 5.0 m/s.
Distance vs Time The graph shows the motion of three different cars. 1 2 Distance (km) Despite different slopes, all three cars have a constant speed. This is because the slope of their line does not change. 3 Time (h) text p.130 Car 1 is traveling at a constant speed, faster than car 2 (slope is steeper). Car 2 is traveling at a constant speed, slower than car 1 (slope is not as steep). Car 3 is stopped. The slope is zero, therefore the speed is zero. The distance does not change as time passes.
Speed-Time Graphs The boat is exhibiting uniform motion, so that means the speed does not change. Speed vs Time Speed (m/s) text p.130 A horizontal line has a slope of zero, and that means that the speed stays constant as time passes. Time (s)
The slope of a line on a speed-time graph indicates that an object is either speeding up or slowing down. Speed vs Time A Object A is increasing its speed (positive slope). Speed (m/s) B Object B is decreasing its speed (negative slope). Time (s) text p.131
The area under the line of a speed-time graph determines the distance the object travels. Speed vs Time A boat is travelling at a rate of 10 m/s for 5.0 s. The area under the line forms a rectangle. 10 Speed (m/s) area = length x width 5.0 Time (s) = 50 m The boat travels a distance of 50 m.
Homework: • read student reference 7: graphing pages 472 - 477 • Line master 1 – Graphical analysis of uniform motion (average speed) • read pages 126 – 133 • B1.1 Check and Reflect page 135 #’s 1 – 13 SHOW YOUR WORK FOR ALL MATHAMETICAL CALCULATIONS!!!!!!!!