Download
1 / 8
80 likes | 211 Views
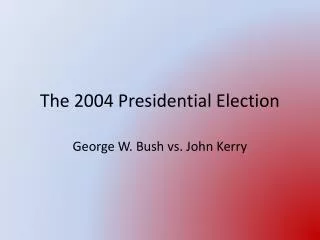
Final 2004 Presidential Election Gallup Poll. Rhajiv Ratnatunga STATS 1000 Seminar 21. Polls are used by politicians and their supporters to gauge their likely election day performance. Gallup Statistical Model.

E N D
Final 2004 Presidential Election Gallup Poll Rhajiv Ratnatunga STATS 1000 Seminar 21
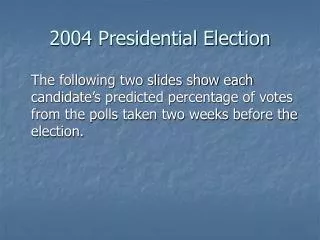
Polls are used by politicians and their supporters to gauge their likely election day performance.
Gallup Statistical Model “President Bush held a 49-47 edge over Sen. John Kerry when the undecided voters were not allocated to a particular candidate. When Gallup, using a statistical model that assumes that 9 of 10 of those voters would support Kerry, allocated the voters, the poll ended as a dead heat with each candidate garnering 49%.” What does this mean? This was the estimate
95% Confidence Interval for Unknown Population Proportion Estimate +/- margin of error = sample proportion +/- 2 standard deviations almost = to sample proportion +/- 2 standard errors = p hat +/- 2 sqrt ((p hat (1-p hat))/n) Explain the multiplier The standard error
Since the population proportion is unknown….. The test for normal approximation is revised by…. Replacing the population proportion with the sample proportion np becomes np(hat) and n(1-p) becomes n(1-p(hat)) Since n is big, we can say without doing calculations that both tests will be larger than 10
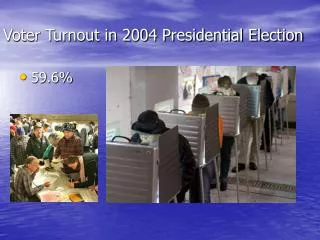
“Results based on likely voters are based on the subsample of 1,573 survey respondents deemed most likely to vote in the November 2004 General Election, according to a series of questions measuring current voting intentions and past voting behavior. For results based on the total sample of likely voters,one can say with 95% confidence that the margin of sampling error is ±3 percentage points.”
John Kerry - .47 + 2 *sqroot ((.47(1-.47))/1573) = .495 = 50% .47 - 2 *sqroot ((.47(1-.47))/1573) = .444 = 44% (44%,50%) = Confidence interval for Kerry George Bush .49 + 2 *sqroot ((.49(1-.49))/1573) = .515 = 52% .49 - 2 *sqroot ((.49(1-.49))/1573) = .444 = .46% (46%, 52%) = Confidence interval for Kerry