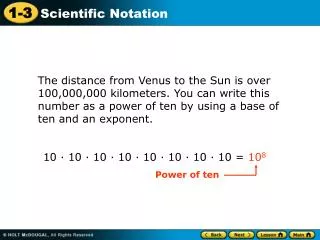
$10
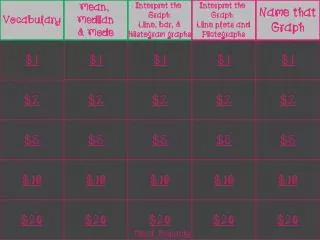
Vocabulary. Mean, Median & Mode. Interpret the Graph: Line, bar, & Histogram graphs. Interpret the Graph: Line plots and Pictographs. Name that Graph. $1. $1. $1. $1. $1. $2. $2. $2. $2. $2. $5. $5. $5. $5. $5. $10. $10. $10. $10. $10. $20. $20. $20. $20.

$10
E N D
Presentation Transcript
Vocabulary Mean, Median & Mode Interpret the Graph: Line, bar, & Histogram graphs Interpret the Graph: Line plots and Pictographs Name that Graph $1 $1 $1 $1 $1 $2 $2 $2 $2 $2 $5 $5 $5 $5 $5 $10 $10 $10 $10 $10 $20 $20 $20 $20 $20 Final Jeopardy
The number that is in the middle of the lower section of data
The number that occurs most often in a set of data is called what?
A bar graph that shows the frequencies of data within equal intervals is what type of graph?
Between which two weeks were there the greatest increase in height?
A vertical graph that uses columns of x’s above a number line to show data
What is the mean? Hours Watching Television on Nov. 11th X X X X X X X X X X X X X X X X X 0 1 2 3 4 5 or more hrs.
How many students watch one hour of TV.? Hours Watching Television on Nov. 11th X X X X X X X X X X X X X X X X X 0 1 2 3 4 5 or more hrs.
What type of graph is shown below? Favorite crayon color Crayon colorsNumber of Students Red Blue Green • Key: = 5 students
What is the most favorite crayon color? Favorite crayon color Crayon colorsNumber of Students Red Blue Green Key: = 5 students
What graph should be used for this set of data? • $1.50-$3.49 • $3.50-$5.49 • $5.50-$7.49 • $7.50-$9.49 • $9.50-$11.49
What graph should be used for this set of data? • Test score • To see the SPREAD of the data • To see how far apart the data is
Extremes: 4, 14 Quartiles: 5,7 Median:6
Shown below is a collection of data about the height of students in a certain classroom. What interval is used? • Height (cm) Frequency • 150-154 2 • 154-158 4 • 158-162 6 • 162-166 4 • 166-170 4 • 170-174 7 • 174-178 4