Download
1 / 28
290 likes | 457 Views
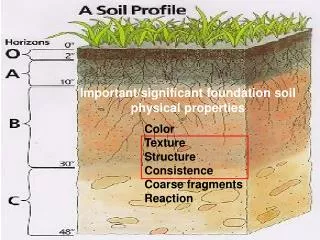
Measuring Soil Physical Properties to Assess Soil Quality. Charles W. Raczkowski North Carolina A&T State University Presented at the Soil Quality Workshop held in Nong Lam University June 2007. Soil Quality.

E N D
Measuring Soil Physical Properties to Assess Soil Quality Charles W. Raczkowski North Carolina A&T State University Presented at the Soil Quality Workshop held in Nong Lam University June 2007
Soil Quality “The capacity of a soil to function within ecosystem boundaries to sustain biological productivity, maintain environmental quality, and promote plant, animal and human health.”
Assessing Soil Quality “A quantitative assessment of soil quality is invaluable in determining the sustainability of land management systems”
Soil Quality Assessment • Choose indicators of soil quality based on the multiple functions of soil that maintain productivity and environmental health. • Must include soil physical, chemical, and biological properties. • Give importance to those soil functions that need to be improved.
Characteristics of U.S. Piedmont Soils • Weak structure • Crust prone • Low infiltration & high runoff rates • Low nutrient & water retention • Highly Erodible
A “minimum set” of physical, chemical and biological properties is chosen to assess the overall function of soil.
The USDA-NRCS Soil Quality Test Kit Collectively, indicators: • are designed as a screening tool to provide immediate results for comparing management systems • can monitor changes in soil quality over time • can diagnose possible health problems due to land use and management.
The USDA-NRCS Soil Quality Test Kit SWTK Characteristics: • Tests can be easily conducted on the farm by field personnel or by landowners. • The kit allows field personnel to be an active participant with the landowner in the assessment of soil quality. • The assessment provides the opportunity to discuss management options.
Property Standards Unlike air quality and water quality assessments, standards do not exist for most soil property indices of soil quality.
Two Ways to Assess Soil Quality • Measurements over time. • Comparisons. Examples: • Measurements in the same field over time. • Problem areas versus non-problem areas. • Compare management systems.
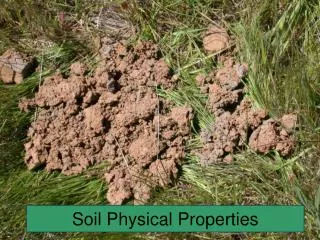
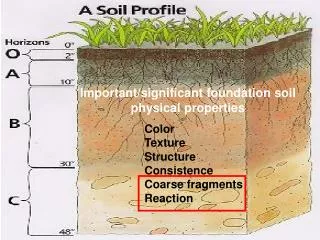
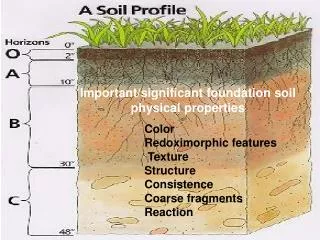
Bulk Density Aggregate Stability Slaking Infiltration Morphological observations Porosity Pore-Size Distribution Soil Strength Water Retention Soil Physical Properties Included in the SWTK
Bulk Density • The ratio of oven-dried soil (mass) to its bulk volume (g/cm3). • Range: 1.00 to 1.80 g/cm3. • Calculation: BD = Oven-Dry Soil Weight Core Sample Volume • Indicator of: Compaction, Pore Space • Related to: Water Dynamics, Root Growth
Aggregate Stability (AS) • Measures the amount (%) of stable aggregates against flowing water. • Calculation: AS = 100 [(Weight of Stable Aggregates) ÷ (Weight of Aggregate Sample Used)] • Indicator: Soil erodibility, soil aggregation (structure).
Infiltration • The entry of water into the soil (cm/hr). • The height (cm) of water entering the soil surface per unit time (hr). • Calculation: Ir = (WV ÷ CA) ÷ Tir where, Ir = Infiltration rate (cm/hr) WV = Volume of water (cm3) infiltrating in time Tir (hr). CA = Cylinder area (cm2) Indicator: Water runoff, erosion, surface crusting.
Increasing soil organic matter improves these soil properties.
AS Ir BD Soil aggregates form around organic residues Processes that disrupt aggregates increase loss of SOM AS Ir BD
More OM is needed to stabilize fine textured soils 16 % clay 39 % 49% 39 % clay 16 % clay 49 % clay Adapted from Russell (1973)
Effect of long term sod on bulk density http://soil.scijournals.org/cgi/content-nw/full/65/3/834/FIG3
20 yrs of bluegrass, then 5 yrs CT corn 25 yrs of CT corn
After adding water “Slaking” after adding water 25 yrs of conventional corn 20 yrs of bluegrass, then 5 yrs conventional corn
Ways to Increase SOM? Soil Quality Physical Chemical Biological Soil Organic Matter
No Tillage and Cover Cropping Improve Soil Quality in North Carolina, USA Charles W. Raczkowski School of Agric. & Env. Sciences North Carolina A&T State University
Soil Quality, Soil-Water Relations, and Soil Erosion: A “hands-on” Demonstration Used for Training of Field Personnel Chris Lawrence, Agronomist, USDA-NRCS, Virginia