Download
1 / 30
300 likes | 334 Views
This research paper explores the Waldmeier Effect, which describes the relationship between the rise time of sunspot cycles and the maximum sunspot number. It discusses the importance of calibrating sunspot records and its impact on understanding solar activity.

E N D
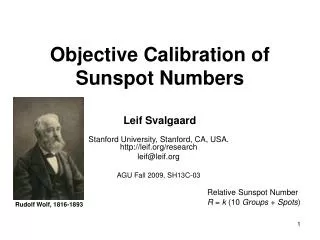
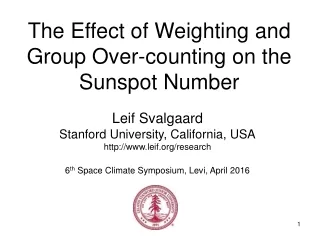
The Waldmeier Effect and the Calibration of Sunspot Numbers Leif Svalgaard Stanford University, California, USA http://www.leif.org/research David H. Hathaway NASA Ames Research Center, California, USA NASA Ames, LMSAL, Stanford, Jan-Feb. 2016
Waldmeier’s Insight The director of the Zürich Observatory (1945-1979) Max Waldmeier reminded us (1978) that “There is a relationship between the rise time T (in years) from minimum to maximum and the maximum smoothed monthly sunspot number RM: log RM = 2.73 – 0.18 T. The times of the extrema can be determined without knowledge of the reduction (or scale) factors. Since this relationship also holds for the years from 1750 to 1848 we can be assured that the scale value of the relative sunspot number over the last more than 200 years has stayed constant or has only been subject to insignificant variations”
The (Misnamed) Waldmeier Effect Although Max Waldmeier today is credited with “the Waldmeier Effect” for the finding that large sunspot cycles have shorter rise times than do small cycles, this fact was known already to Wolf (we are still basically using his determinations of the times of early minima and maxima) and was seriously discussed around the turn of the 20th century (e.g. Halm 1901, 1902; Lockyer 1901; and Wolfer 1902 [Figure below]) and taken as evidence for an ‘eruption-type’ sunspot cycle freed from ‘the shackles of unduly close adherence to harmonic analysis’ (Milne 1935), although the allure of ‘oscillators’ still rears it (ugly) head today… Rise Time Rz Phase in cycle Waldmeier’s one-parameter curve family for the sunspot number through the cycle (Waldmeier 1968)
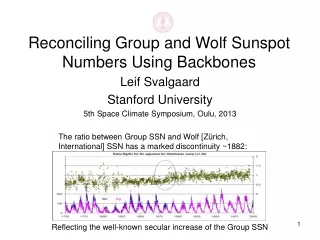
The (Old) Group Sunspot Number Secular Increase Grand Minimum! Grand Maximum? Douglas Hoyt and Ken Schatten proposed (1995) to replace the sunspot number with a count of Sunspot Groups. H&S collected almost ½ million observations (not all of them good) and labored hard to normalize them to modern observations “I didn’t see any spots this year” The secular increase is discordant with Waldmeier’s conclusion. What to do?
The SSN Workshops. The Work and Thoughts of Many People Sunspot, NM, 2011 Brussels, BE, 2012 Sunspot, NM, 2012 Locarno, CH, 2014 Brussels, BE, 2015 Tucson, AZ, 2013 http://ssnworkshop.wikia.com/wiki/Home
The New Sunspot and Group Numbers Svalgaard & Schatten, 2015 Same Level in each Century A concerted effort by many people (the SSN Workshops) have led to revision of both the Sunspot Number and the Group Number Clette at al., 2015 With good accuracy we have the following scale factor: SN = 20 GN
Why is Calibration so Important? Kopp et al., 2016 TSI With Total Solar Irradiance (TSI) reconstructed from the H&S Group Sunspot Number an argument could be (and has been) made that ‘Global Warming’ was driven by increasing solar irradiance since 1700 AD. With the revised sunspot record, this argument does not seem effective anymore. Needless to say, the failure of the argument will spark ‘rearguard’ actions to preserve the old H&S record (and thus uphold the failing argument) which is why the correct calibration of the sunspot record has become a timely and ‘hot’ topic.
The Waldmeier Effect in Action 18th 19th The boxes show the growth phase of each cycle: for large cycles the rise time is short, for small cycles it is longer. The numbers shown are in years taken from the table on the next slide 20th
Table of Published Rise Times Using the New Sunspot Number SN T1 is original Rise Times given by Waldmeier T6 and T7 are by Hathaway
Waldmeier Effect Now Log(SNMax) pink Rise Time T black, Waldmeier relation red Log(1/0.6) = 0.22 Again: rises to same level in each century As curiosum: the Hoyt & Schatten Group Sunspot Number [green triangles] does not show consistent Waldmeier Effect, as the cycle sizes are too small before Cycle 12
Waldmeier Effect in Ri* http://users.telenet.be/j.janssens/Engzonnecyclus.html gives a nice table with solar cycle parameters (using the International Sunspot Number, version 1). We plot the Effect after correcting Ri for weighting: ? 14 Cycle 14 has a very flat maximum and the rise time should probably be increased a bit
Filtering to Remove Short-period Fluctuations Suitable filters should have Gaussian shapes in the frequency domain and effectively remove high frequency variations (Hathaway et al., 1999). A tapered (to make the filter weights and their first derivatives vanish at the end points) Gaussian filter, as used by Hathaway (2015), is and t is time from the center of the filter in a suitable unit (e.g. 1 month or 1 solar rotation) and 2a is the Full-Width-at-Half-Maximum of the filter in the same unit. The significant variations in solar activity on time scales of one to three years that can produce double peaked maxima are filtered out by this 24-month Gaussian filter, i.e. with a = 12 months. To remove the (large) rotational variation we can also use 27-day Bartels rotation averages as well as the more traditional monthly means.
Determining the Extrema We fit a quadratic function to the smoothed sunspot curves (pink) and get the extrema (time and amplitude) the usual way, e.g. Time = |b|/(2a)
Waldmeier Effect Using Gaussian Filter Same level in each century We recover the Waldmeier Effect both in the filtered (24-month) monthly means (light blue for Trise, red for Sunspot Numbers) and in the filtered (27-rotation) Bartels Rotations (dark blue for Trise, pink for SN)
Fitting the Whole Cycle to an Analytic Function Hathaway (1999, 2015) suggested to determine the rise times from fitting an analytic function to the entire cycle. Because cycles usually overlap during minima, we use the fit of the previous cycle to remove it from the sunspot numbers over the minimum. We define a new time parameter: to use in a function for the sunspot number, SN, that is a cubic in the rise and a falling exponential in the decline of each cycle: and determine tmin, and the coefficients A, B, and C by least squares. The amplitude and rise time can now be obtained by finding extrema at zeroes of the first derivative: SNmax = 0.522AB3Rise time = (1.072+0.387 C – 0.520 C2)B months = 1.053 B for C= 0.795 (all-cycle average)
Waldmeier Effect from Cycle Fits This approach also recovers the Waldmeier Effect GN log SNmax = 2.86 – 0.16 T With the exception (open circles) of Cycles 6 and 9, perhaps due to the atypical cycles at that time
The Fits to Cycle 6 to 9 are not Good. Every method has its strong points and its weak points ‘Eyeballed’ Fits
Waldmeier Effect in Sunspot Areas It has been reported (Dikpati et al. 2009) that the Waldmeier Effect is not found in sunspot areas. We show here that it is present, nevertheless: The sunspot areas, SA (Balmaceda et al., 2008), have been converted to equivalent sunspot numbers, SA*, according to SA* = 0.51 SA0.732
Geomagnetic Variation rY Discovered in 1722, related to solar cycle 1852, due to electric dynamo current in ionosphere created and maintained by solar EUV
Reconstruction of EUV (and F10.7) Flux from Geomagnetic Diurnal Variation
Waldmeier Effect From Geomagnetism Using the shapes of the ‘geomagnetic cycles’ and of the observed [and scaled] F10.7 cycles
Heliospheric Magnetic Field and EUV As the magnetic field in the solar wind (the Heliosphere) ultimately arises from the magnetic field on the solar surface filtered through the corona, one would expect, at least an approximate, relationship between the network field and the Heliospheric field: Assuming that the EUV flux results from release of stored magnetic energy and therefore scales with the energy of the network magnetic field (B2), we can understand the correspondence between the Heliospheric field and the network field. Again, the field in the 19th century was on par with modern values
Heliospheric Magnetic Field from 10Be R2 = 0.048 R2 = 0.001 21
Compare with Cosmic Ray Modulation ‘Measured’ Too large? Raymond Muscheler Solar activity reaching the same levels in each of the last 4 centuries
Another 14C Reconstruction Usoskin et al. 2016 Scaled too high Old V1 Again: same max. level in 17th, 18th, and 19th Centuries (no 20th Century data because of Suess effect – burning of fossil fuels)
Overview Showing Basic Agreements The issue with the Modern Grand Maximum depends on the data for the 20th Century, where actually our data are plentiful and good
The Growling Consensus (!?) Lockwood et al., 2015 SolarOpen Flux Usoskin et al., 2015 Cosmic Ray Modulation Svalgaard & Schatten, 2015 Sunspot Group Number
Conclusions • The Waldmeier Effect can be seen in all solar activity indices with at least annual time resolution • The Effect does not depend on knowledge about the scale value of the indices • And can therefore be used to show that the scale values have not changed at least the past 250 years • From which one can conclude that our records that show that Solar Activity reached the same level in each century from the 18th onwards (and possibly from the 17th as well) are very likely correct • Therefore the Modern Maximum has not been particularly Grand compared to the maxima in previous centuries, contrary to the Group Sunspot Number record by Hoyt & Schatten • Several recent attempts to resurrect the H&S GSN are therefore spurious (“To kill an error is as good a service as, and sometimes even better than, the establishing of a new truth or fact”, Charles Darwin)
The ‘Other’ Waldmeier Effect If we define the ‘growth rate’, g, of a cycle as its maximum sunspot number divided by the rise time, the ‘normal’ Waldmeier Effect implies that g = SNmax/T also should be larger for large cycles than for small cycles, and so it is, SNmax = g T ≈ 400 T exp(-T/2): Blue = publ. dataPink = Gaussian fitsGreen = areas Small cycles Large cycles This relationship is what our theories and models should explain
Abstract The Waldmeier Effect is the observation that the rise time of a sunspot cycle varies inversely with the cycle amplitude: strong cycles rise to their maximum faster than weak cycles. The shape of the cycle and thus the rise time does not depend on the scale factor of the sunspot number and can thus be used to verify the constancy of the scale factor with time as already noted by Wolfer (1902) and Waldmeier (1978). We extend their analysis until the present using the new SILSO sunspot number (version 2) and group number and confirm that the scale factors have not varied significantly the past 250 years. The effect is also found in sunspot areas, in an EUV (and F10.7) proxy (the daily range of a geomagnetic variation), and in Cosmic Ray modulation. The result is that solar activity reached similar high values in every one of the (17th?) 18th, 19th, and 20th centuries, supporting the finding that there has been no modern Grand Maximum.