Download
1 / 18
180 likes | 215 Views
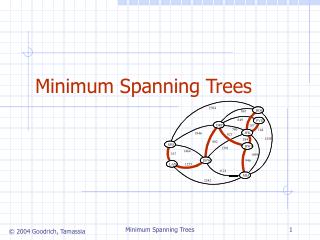
Minimum Spanning Trees Displaying Semantic Similarity. W ł odzis ł aw Duch & Pawe ł Matykiewicz Department of Informatics, UMK Toruń School of Computer Engineering, NTU Singapore Cincinnati Children’s Hospital Research Foundation, OH, USA Google: Duch. The Problem.

E N D
Minimum Spanning TreesDisplaying Semantic Similarity Włodzisław Duch & Paweł Matykiewicz Department of Informatics, UMK Toruń School of Computer Engineering, NTU Singapore Cincinnati Children’s Hospital Research Foundation, OH, USA Google: Duch
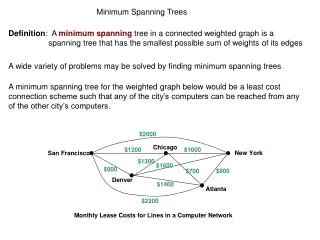
The Problem • Finding people who share some of our interests in large organizations or worldwide is difficult. • Analyzing people’s homepages and their lists of publications is a good way to find groups and individuals sharing common scientific interest. • Maps should display individuals and groups. • The structure of graphical representations depends strongly on the selection of keywords or dimensionality reduction.
The Data • Reuters-215785 datasets, with 5 categories and 1 – 176 elements per category. • 124 Personal Web Pages of the School of Electrical and Electronic Engineering (EEE) of the Nanyang Technological University (NTU) in Singapore, with 5 categories (control, microelectronics, information, circuit, power), and 14 – 41 documents per category.
Document-word matrix • Document1: word1 word2 word3. word4 word3 word5. • Document2:word1 word3 word5. word1 word3 word6. • The matrix: documents x word frequencies
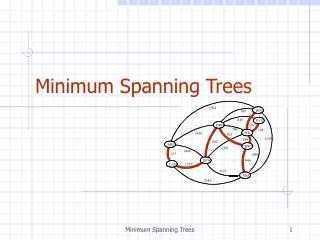
Methods used • Inverse document frequency and term weighting. • Simple selection of relevant terms. • Latent Semantic Analysis (LSA) for dimensionality reduction. • Minimum Spanning Trees for visual representation. • TouchGraph XML visualization of MST trees.
Data Preparation • Normalize columns of F dividing by highest word frequencies: • Among n documents, term j occurs djtimes; inverse document frequency idfj measures uniqueness of term j: • tf x idfterm weights:
Simple selection • Simple selection: take wij weights above certain threshold, binarize and remove zero rows: • Calculate similarity using cosine measure:
Dimensionality reduction • Latent Semantic Analysis (LSA): use Singular Value Decomposition on weight matrix W with U = eigenvectors of WWT and V of WTW. Remove small eigenvalues, recreate reduced W and calculate similarity:
Modified Kruskal’s Algorithm and Bottom - Up Clusterization
Reuters results Method topics clusters accuracy No dim red. 41 129 78.2% LSA dim red. 0.8 (476) 41 124 76.2% LSA dim red. 0.6 (357) 41 127 75.2% Simple Selection 41 130 78.5% W rank in SVD = 595
Results for EEE NTU Web pages Method topics clusters accuracy No dim red. 10 142 84.7% LSA dim red. 0.8 (467) 10 129 84.7% LSA dim red. 0.6 (350) 10 137 82.8% Simple Selection 10 145 85.5%
Examples • TouchGraph LinkBrowser • http://www.neuron.m4u.pl/search
Results for Summary Discharges New experiments on medical texts. 10 classes and 10 documents per class: • Plain Doc-Word matrix ≈ 23% • Stop-List, TW-IDF, S.S. ≈ 64% • Concept Space ≈ 64% • Transformation ≈ 93%
Summary • In real application knowledge-based approach is needed to select only useful words and to parse their web pages. • Other visualization methods (like MDS) may be explored. • People have many interests and thus may belong to several topic groups. • Could be a very useful tool to create new shared interest groups in the Internet.