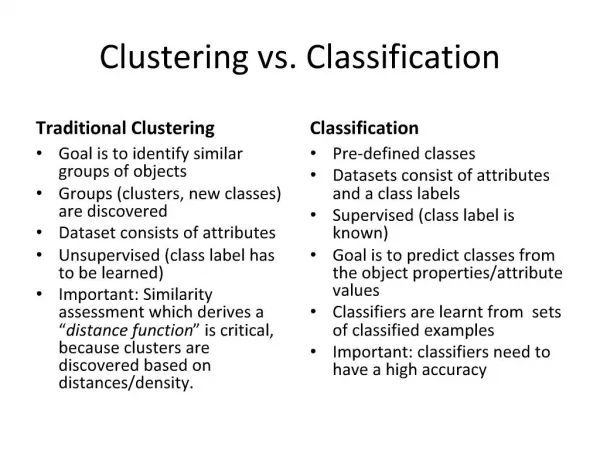
Visualization for Classification and Clustering Techniques
Visualization for Classification and Clustering Techniques. Marc René CSE 8331 Data Mining - Project 1. Overview. Importance of Data Visualization in the KDD Process Understanding and Trust Visualization techniques Classification Clustering Future Directions. KDD Process. Selection


Visualization for Classification and Clustering Techniques
E N D
Presentation Transcript
Visualization for Classification and Clustering Techniques Marc René CSE 8331 Data Mining - Project 1
Overview • Importance of Data Visualization in the KDD Process • Understanding and Trust • Visualization techniques • Classification • Clustering • Future Directions Marc René - CSE 8331
KDD Process • Selection • Obtain data from all of sources • Preprocessing • After selecting the data, clean it to make sure it is consistent • Transformation • After preprocessing the data, analyze the format/amount of data • Data Mining • Once the data is in a useable format/content, apply various algorithms based upon the results trying to be achieved • Interpretation/Evaluation • Finally, present the results of the data mining step to the user, so that the results can be used to solve the business need at hand Marc René - CSE 8331
Importance of Data Visualization The final step in the KDD process : • Highly dependent on the Data Visualization technique • Bad/inappropriate technique may result in misunderstanding • Misunderstanding may cause an incorrect (or no) decision It is important to consider that the KDD process is useless if the results are not understandable Marc René - CSE 8331
Current Issues w/Data Visualization • The literature suggests a significant reliance on expert users • General lack of data visualization support in many data mining tools [Goebel99] • These are significant problems if KDD/DM/Data Visualization will expand at the rates suggested • Data visualization tool market – $2.2 billion by 2007 [Nuttall03] Marc René - CSE 8331
Suggested Direction • Need to determine techniques that balance simplicity with completeness • If this can be done for non-expert users • Simplicity & Completeness Understanding • Understanding Trust • Trust more use of KDD/DM • Result will be: • Better business value • Higher ROI Marc René - CSE 8331
Common Visualization Techniques • Visualization techniques dependent upon • The type of data mining technique chosen • The underlying structure and attributes of the data Classification Clustering • Decision Trees - Scatter Plots • Scatter Plots - Dendrograms • Axis-Parallel Decision Trees - Smoothed Data Histograms • Circle Segments - Self-Organizing Maps • Decision Tables - Proximity Matrixes Marc René - CSE 8331
Classification Marc René - CSE 8331
Decision Tree • Information limited to • Attributes • Splitting values • Terminal node class assignments Marc René - CSE 8331
Decision Tree with Histograms • Data mining rarely classify 100% of the data correctly: • Include the success of properly classifying the data - histogram added for each terminal node • Percentage of data that was classified correctly/incorrectly • Assists users in determining if the classification is ‘good enough’ Marc René - CSE 8331
Decision Tree - Different Format • Vertical representation - allows for easy user interaction • Combines the split points and classification accuracy - compactly • Key difference - colors are matched with a specific classification Marc René - CSE 8331
Scatter Plot with Regression Line • Excellent way to view 2-dimensional data • Familiar to anyone who has taken high-school algebra • Regression lines provide descriptive techniques for classification Marc René - CSE 8331
Axis-Parallel Decision Tree • Combination Scatter Plot and Decision Tree • Areas divided in parallel regions on the axis • Well suited for classification problems with two attribute values • High visibility into the impact of outliers Marc René - CSE 8331
Circle Segments • Multi-dimension data • Maps dataset with n dimensions onto a circle divided by n segments • Each segment is a different attribute • Each pixel inside a segment is a single value of the attribute • Values of each attribute are then sorted (independently) and assigned a different colors based upon its class Marc René - CSE 8331
Decision Table • Interactive technique • Maps attribute data to a 2D hierarchical matrix • Levels can be drilled down - another set of attributes • Height of a cell conveys the number of data entities • Cells color coded • Neutral color no data in that intersection point • Color coded by class (percentage) Marc René - CSE 8331
Decision Table Marc René - CSE 8331
Clustering Marc René - CSE 8331
Scatter Plot • Extensions include, displaying points in: • Various sizes and colors to indicate additional attributes • Shading of points to introduce a third dimension • Using different brightness levels of the same color to represent continuous values for the same attribute • Using various points or classification identifiers (i.e., numbers, symbols) • Using various glyphs to display additional attributes Marc René - CSE 8331
Scatter Plot • Map decision trees on top of scatter plots to describe clusters Marc René - CSE 8331
Scatter Plot with Regression Lines Marc René - CSE 8331
Scatter Plot w/Min Spanning Tree Marc René - CSE 8331
Dendrogram • Intuitive representation - hierarchical decomposition of data into sets of nested clusters. • From an agglomerative perspective: • Each leaf - a single data entity • Each internal node - the union of all data entities in its sub-tree • The root - the entire dataset • The height of any internal node - the similarity between its ‘children’. Marc René - CSE 8331
Dendrogram with Exemplars • The “most typical member of each cluster” [Wishart99] • Underlined labels of the leafs • Done in combination with shading to identify the clustering level Marc René - CSE 8331
Smoothed Data Histogram • Represents data on a ‘display map’ • Similar data items are located close to each other • More defined the clusters – lighter colors Marc René - CSE 8331
Smoothed Data Histogram - Detail Marc René - CSE 8331
1 5 2 3 2 5 6 5 2 2 2 4 5 5 5 7 1 1 1 5 7 7 8 7 7 7 10 7 7 9 7 7 11 7 8 7 10 7 Self-Organizing Map ‘Grid’ • Source of Smoothed Data Histogram • Numbers indicate most ‘common’ cluster Marc René - CSE 8331
Proximity Matrix • Graphically display the relationship between data elements • Usually symmetric, but can be sorted by the strength of relationships Marc René - CSE 8331
Proximity Matrix and Dendrogram Marc René - CSE 8331
Summary • Data visualization techniques are extremely important for understanding the KDD process • A balance of simplicity and completeness is important • The techniques discussed allow average users to understand the results of the KDD process • Understanding KDD results to be interpreted/trusted by non-expert users extending the business value • If data visualization techniques do not establish a high level of trust in the KDD process, the process will fail Marc René - CSE 8331
Future Direction • Significant effort will be spent on improving data visualization techniques in the next few years • KDD process and data mining are becoming more widespread • Business will expect tools to become more ‘user-friendly’ and support the varied level of skills • Trends are moving to a more interactive mode • Static reporting techniques (i.e., standard decision trees, standard circle segments) are being replaced • Interactive techniques (i.e., smoothed data histograms, interactive circle segments and decision tables) • Very interactive data models ‘virtual reality’ are also being considered/proposed Marc René - CSE 8331
ReferencesPart 1 Ahlberg, C., “Spotfire: An Information Exploration Environment”, ACM SIGMOD Record, Volume 25, Number 4, December 1996 Ankerst, M., et. al., “Visual Classification: An Interactive Approach to Decision Tree Construction”, KDD-99, San Diego, CA Ankerst, M., et. al., “Towards an Effective Cooperation of the User and the Computer for Classification”, KDD’00, Boston, MA, USA Apte C. and Weiss S.M., “Data Mining with Decision Trees and Decision Rules”, Future Generation Computer Systems, November 1997 Arkin, E., et. al., “Decision Trees for Geometric Models”, ACM, 9th Annual Computational Geometry, 5/93/CA, USA de Hann, G., et. al., “Towards Intuitive Exploration Tools for Data Visualization in VR”, VRST’02, November 11-13, 2003, Hong Kong Dunham, M. H., Data Mining – Introductory and Advanced Topics, Prentice Hall, 2003. Fekete, J. and Plaisant, C., Excentric Labeling: Dynamic Neighborhood Labeling for Data Visualization, Proceedings of the Conference on Human factors in Computer Systems (CHI'99), ACM , New York Fredrikson, A., et. al., “Temporal, Geographical and Categorical Aggregations Viewed through Coordinated Displays: A Case Study with Highway Incident Data”, NPIVM’99, Kansas City, MO, 1999 Goebel, M. and Gruenwald, L., “A Survey of Data Mining and Knowledge Discovery Software Tools”, SIGKDD Explorations, June 1999. Han, J. and Cersone, N., “RuleViz: A Model for Visualizing Knowledge Discovery Process”, Sixth International Conference on Knowledge Discovery and Data Mining, 2000 Ho, T., et. al., “Visualization Support for a User-Centered KDD Process”, SIGKDD’02, 2002. Marc René - CSE 8331
ReferencesPart 2 Hsieh, H. and Shipman, F. M. III, “VITE: A Visual Interface Supporting the Direct Manipulation of Structured Data Using Two-Way Mappings”, IUI 2000, New Orleans LA “Solving Business Problems with IBM DB2 Intelligent Miner”, Presented by DB2 Developer Domain, http://www7b.software.ibm.com/dmdd Jain, A. K., et. al., “Data Clustering: A Review”, ACM Computing Surveys, Volume 3, Number 3, September 1999 Keim, D. A., “Visual Techniques for Exploring Databases”, KDD’97, Newport Beach, CA, 1997 Kohavi, R., and Sommerfield, D, “Targeting Business Users with Decision Table Classifiers”, KDD’99, New York City, 1998 Kohavi, R., et. al., “Emerging Trends in Business Analytics”, Communications of the ACM, Volume 45, Number 8, August 2002 Liu, B., et. al., “Clustering Through Decision Tree Construction”, CIKM 2000, ACM, McLean VA, 2000 Louie, J. Q. and Kraay, T., “Origami: A New Visualization Tool”, KDD-99, San Diego, CA Moret, B. M. E., “Decision Trees and Diagrams”, Computing Surveys, Volume 14, Number 4, December 1982 Nuttall, C., "It's a Vision Thing", Financial Times-IT Review , November 12, 2003 Pampalk, E. et. al., “Using Smoothed Data Histograms for Cluster Visualization in Self-Organizing Maps”, Proceeding of the International Conference on Artificial Neural Networks (ICANN’02), Springer Lecture Notes in Computer Science, Madrid Spain, 2002 Pampalk, E. et. al., “Content-based Organization and Visualization of Music Archives”, Proceeding of the 10th ACM International Conference on Multimedia (MM’02), Juan-les-Pins, France, 2002 Pampalk, E., et. al., “A New Approach to Hierarchical Clustering and Structuring of Data with Self-Organizing Maps”, Intelligent Data Analysis Journal (IDA), Volume 8, Number 2, 2003 Marc René - CSE 8331
ReferencesPart 3 Rauber, A., et. al., “Empirical Evaluation of Clustering Algorithms”, Journal of Information and Organizational Sciences (JIOS), Volume 24, Number 2, 2000 “Finding the Solution to Data Mining – Exploring the Features and Components of Enterprise Miner, Release 4.1 from SAS” SAS White Paper, 2001 See5 - Data Mining Tools, Release 1.9, Rulequest Research 1997-2003 Simoff, S. J., “VDM@ECML/PKDD2001: The International Workshop on Visual Data Mining at ECML/PKDD 2001”, SIGKDD Explorations, Volume 3, Issue 2, 2001 Thearling, K., “Understanding Data Mining: It’s All in the Interaction”, DS Star: The On-Line Executive Journal for Data-Intensive Decision Support”, Volume 1, Number 10, December 9, 1997 Thearling, K., et. al., “Visualizing Data Mining Models”, as published in Information Visualization in Data Mining and Knowledge Discovery, edited by Fayyad, Usama, et. al., Morgan Kaufman, 2001 Ward, M. O., “XmdvTool: Integrating Multiple Methods for Visualizing Multivariate Data”, Proceedings of IEEE Visualization '94 (Washington, DC, 1994). Wishart, D., “Efficient Hierarchical Cluster Analysis for Data Mining and Knowledge Discovery”, Computing Science and Statistics, Volume 30, 1998. Wishart, D., “ClustanGraphics3 – Interactive Graphics for Cluster Analysis”, Published in: Classification in the Information Age, Gaul W. and Locarrek-Junge, H (Eds.), Springer 1999 XmdvTool Home Page (http://davis.wpi.edu/~xmdv/visualizations.html) Marc René - CSE 8331