Download
1 / 34
340 likes | 365 Views
Simulating Ionospheric Scintillation of GPS Signals for Resilient PNT Testing and Challenges in Developing a Standardised Test Framework for Ionospheric Threats. Talini Pinto Jayawardena 20 May 2019. Table of Contents. Ionospheric Scintillation & Impact on GNSS. Ionospheric Scintillation.

E N D
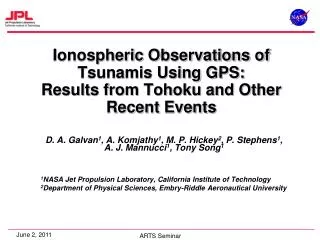
Simulating Ionospheric Scintillation of GPS Signals for Resilient PNT Testing and Challenges in Developing a Standardised Test Framework for Ionospheric Threats Talini Pinto Jayawardena 20 May 2019
Ionospheric Scintillation Electron density structures result in diffraction/refraction of electromagnetic signals Rapid fluctuation of signal amplitude/phase Structures ≈ Signal Wavelength – largely diffraction Structures >> Signal Wavelength – largely refraction
Ionospheric Scintillation Different mechanisms contribute to scintillation in different regions Leads to variations in scintillation properties with: Time of day Geomagnetic location Season Solar activity Credit: Paul Kintner
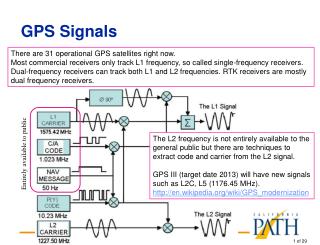
Effects on GNSS Scintillation strengths a function of frequency • Equatorial Regions: • GNSS signals experience mainly diffraction processes • Largely amplitude scintillation causing deep signal fades • Strong scintillation events accompanied by phase scintillations
Effects on GNSS High Latitudes: Main cause of scintillation is signal refraction Dominated by phase scintillation • Impact on Users: Disruption of receiver tracking capability • Loss of signal lock leading to degraded accuracy, availability and reliability • Concern for safety-critical and PPP applications
Impact on Real Systems Case Study 1: Equatorial Aviation Investigative Study over Ascension Island (Akala et al, 2012) 15-day campaign to monitor GPS scintillation during solar maximum year 2002 Intense scintillation seen on almost all nights leading to navigation outages (<4 satellites in view 5 or more satellite experiencing strong scintillation simultaneously
Impact on Real Systems Case Study 1: Equatorial Aviation Investigative Study over Ascension Island (Akala et al, 2012) Outages during strong scintillation range from 1-50s Degradation of precision and horizontal/vertical errors exceeding ICAO requirements on HAL/VAL for APV I & II approach operations
Impact on Real Systems Case Study 2: Oil & Gas Industry Real-life examples: Good integrity indicator on a multi-constellation system but location compromised 5 minutes later Operations (e.g. deep water installations/drilling) halted for hours each day Significant impact on: Safety – primary concern Economic Loss – all systems on standby with possible losses of ~$10K/hour Experiences 10-50m position errors, loss of differential corrections and loss of signal kriskrüg [CC BY-SA 2.0 (https://creativecommons.org/licenses/by-sa/2.0)]
Impact on Real Systems Case Study 3: Precision Agriculture Precision farming technologies suffer from scintillation effects (e.g. RTK, PPP) Particularly equatorial regions Industry actively developing technologies to counter scintillation effects Seeking comprehensive test frameworks with realistic scintillation models for technology assessment User:bdk / Wikimedia Commons / CC BY-SA 3.0 Credit: contains modified Copernicus Sentinel data (2016), processed by ESA, CC BY-SA 3.0 IGO
Climate Vs Weather Conventional methods for scintillation testing use statistical modelling and simulations MIDAS Image (from measurements) IRI Statistical Model Credit: Cathryn Mitchell Credit: Cathryn Mitchell
Variability in Receiver Performance Cape Verde Normalised standard deviation of signal intensity Metric to measure signal fading P: Power
Variability in Receiver Performance Receiver Performance Tromso RMS phase deviation
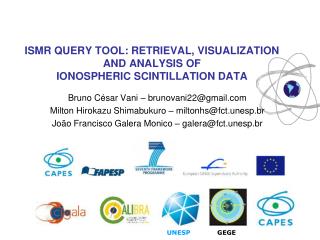
Access to Data Ionospheric Scintillation Monitoring (ISM) networks are largely regional and isolated (e.g.): SCINDA CIGALA/CALIBRA – Brazil INGV networks – Arctic, Antarctica, Mediterranean Sea, Equatorial SAGAIE – Africa SWS – Australia Individual sites from various universities (E.g. University of Bath) Majority of networks are setup via research projects Networks may not perform continuous monitoring due to project/funding timelines Not easily accessible by industry for commercial use
“… GPS receivers are usually designed and subjected to bench tests via modelling and simulations to ascertain their capabilities [Hegarty et al., 2001; Conker et al., 2003; Humphreys et al., 2009, 2010a, 2010b], but these testing strategies can give misleading results if the scintillation time histories […] are not realistic” “… in field testing at Ascension Island during the solar maximum years of solar cycle 23, Bishop et al. [1998], Groves et al. [2000] and Ganguly et al. [2004] observed receiver performance degradations that were much worse than those anticipated by the simulations […] conducted prior to the campaign” Akala et al., Impacts of ionospheric scintillations on GPS receivers intended for equatorial aviation applications, Radio Science, Vol 47. RS4007, 2012
The combination of real scintillation signatures and empirical data are more likely to represent realistic conditions than the traditional empirical approach on its own Requires a dense, global network of data sites to maximise the variety of scintillation signatures available and to develop accurate empirical models
The Scintillation Strength Indicator (SSI) Acknowledgements: C. Mitchell, R. Boyles, j. Bruno, K. Bolmgren, B. Forte, R. Watson, G. Buesnel and Innovate UK
The Model Based on empirical models of scintillation strengths (i.e. S4 or ) developed from recorded data Data collected from Cape Verde (equatorial) and Tromso, Norway (high-latitude) Combines empirical models with the use of real scintillation signatures Scintillation events generated in 3 stages Generic scintillation strength modelling Satellite-specific scintillation modelling (satellite elevation, receiver location) Scintillation profile application
The Model 3 Stages of the Model Satellite-specific scintillation strength modelling Generic scintillation strength modelling Scintillation profile application
The Model Empirical Modelling S4 Levels Solar Activity
The Model Performance Model accuracy (for elevations > 20°) Equatorial Regions: S4 error = ±0.2 91.75% error = ±0.2 96% High Latitude Regions: S4 error = ±0.1 100% error = ±0.2 97% Equatorial 27 Feb 2012 21 Mar 2012 High Latitude 21 Mar 2012 21 Mar 2014
Assumptions & Limitations Assumptions due to data sites being geographically constrained All longitudes experience similar levels of scintillation at a given latitude (geomagnetic grid) Scintillation strengths of northern latitudes mirrored about the equator Current capability limited to GPS only L2 and L5 scintillation signatures derived from L1 No data available for other GNSS constellations Receiver processing effects have minimal effect on extracted scintillation profiles
Future Work “Any roadmap information provided in this presentation is for informational purposes only and is subject to change. No contractual commitments are being made or implied”
Comprehensive Ionospheric Threat Modelling Extend SSI to other GNSS signals Add global TEC/electron density map capability to model the ionosphere More accessible and understandable by user Space weather event modelling – geomagnetic storms Ionospheric delays obtained from electron density reconstructions of specific events Addition of scintillation based on gradients in electron density Credit: Cathryn Mitchell
Ionospheric scintillation is a highly dynamic phenomenon that impacts GNSS signal amplitude and phase Particular concerns for safety critical and PPP sectors Industries require a test framework that can be used for evaluating their PNT systems under scintillation/space weather conditions Current simulation capabilities underestimate real conditions The combination of real scintillation signatures and empirical data are more likely to represent realistic conditions Tangible need for the collaboration of research/academia with industry to share data on scintillation/space weather
Ionospheric Scintillation Equatorial Scintillation Plasma bubbles with small scale structuring during post sunset http://www.vklogger.com/forum/download/file.php?id=962&mode=view
Ionospheric Scintillation High Latitude Scintillation Large scale ExB plasma convection system across polar regions
Impact on Real Systems Case Study 1: Equatorial Aviation Investigative Study over Ascension Island (Akala et al, 2012) Outages during strong scintillation range from 1-50s Degradation of precision and horizontal/vertical errors exceeding ICAO requirements on HAL/VAL for APV I & II approach operations
“Although there is a growing realization that vulnerability arises not simply due to low-frequency and high-impact events, but also due to continuing degradation as a consequence of many smaller impacts, understanding the most severe event that might occur is crucial for disaster planning scenarios.” Eastwood et al., The Economic Impact of Space Weather, Risk Analysis, Vol 37. No. 2, 2017