Download
1 / 2
20 likes | 119 Views
When you choose colors in MSGraph, you see a dialog box something like this. See the following page for a table of the RGB values for each of these color “chips”. Periodic Table of the Graph. 13408767. 16711935. N/A. 128. 255. 10079487. 26367. 52479. 39423. N/A. 10092543. 52377.

E N D
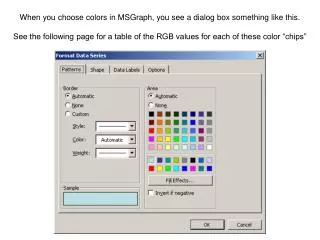
When you choose colors in MSGraph, you see a dialog box something like this. See the following page for a table of the RGB values for each of these color “chips”
Periodic Table of the Graph 13408767 16711935 N/A 128 255 10079487 26367 52479 39423 N/A 10092543 52377 32896 65535 N/A 13434828 6723891 65280 32768 N/A 16776960 13421619 16777164 8421376 N/A 16764057 16763904 16711680 16737843 N/A 13395456 16751052 10053222 6697881 8388736 12632256 16777215 16764108 9868950 8421504 First six colors on this row come from current PPT slide’s Color Scheme R/G/B Index RGB Long Each rectangle in table below corresponds to a color chip in the MSGraph palette at left Mac RGB 0 13209 13107 13056 6697728 8388608 10040115 3355443 1 53 52 51 49 11 55 56 0/0/144 9 46 12 10 14 5 47 16 144/113/58 0/100/17 0/0/212 144/0/0 3 45 43 50 42 41 13 48 70/0/165 221/8/6 7 44 6 4 8 33 54 15 242/8/132 252/243/5 31/183/20 0/171/234 38 40 36 35 34 37 39 2 17 18 19 20 21 22 23 24 255 65535 65280 16776960 16711935 16711935 8421376 16711680 25 26 27 28 29 30 31 32