Download
1 / 45
450 likes | 515 Views
Explore the milestones, statistics, and global efforts in combating the HIV/AIDS epidemic since its emergence, including key events and regional data. Know about the first cases, treatments, and initiatives that shape the fight against this disease.

E N D
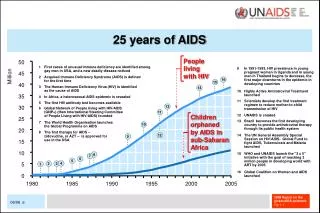
25 years of AIDS People living with HIV 50 1 First cases of unusual immune deficiency are identified among gay men in USA, and a new deadly disease noticed 9 In 1991-1993, HIV prevalence in young pregnant women in Uganda and in young men in Thailand begins to decrease, the first major downturns in the epidemic in developing countries 45 Million 2 Acquired Immune Deficiency Syndrome (AIDS) is defined for the first time 40 3 The Human Immune Deficiency Virus (HIV) is identified as the cause of AIDS 10 Highly Active Antiretroviral Treatment launched 35 4 In Africa, a heterosexual AIDS epidemic is revealed 11 Scientists develop the first treatment regimen to reduce mother-to-child transmission of HIV 5 The first HIV antibody test becomes available 30 6 Global Network of People living with HIV/AIDS (GNP+) (then International Steering Committee of People Living with HIV/AIDS) founded 11 Children orphaned by AIDS in sub-Saharan Africa 12 UNAIDS is created 25 13 Brazil becomes the first developing country to provide antiretroviral therapy through its public health system 7 The World Health Organisation launches the Global Programme on AIDS 20 8 The first therapy for AIDS – zidovudine, or AZT -- is approved for use in the USA 14 The UN General Assembly Special Session on HIV/AIDS. Global Fund to fight AIDS, Tuberculosis and Malaria launched 15 12 10 15 WHO and UNAIDS launch the "3 x 5" initiative with the goal of reaching 3 million people in developing world with ART by 2005 5 13 4 5 6 8 1 9 14 15 2 7 10 3 16 16 Global Coalition on Women and AIDS launched 0 2005 1980 1985 1990 1995 2000
Global HIV prevalence in adults, 1985 UNAIDS/WHO, 2006
Global HIV prevalence in adults, 1995 UNAIDS/WHO, 2006
Global HIV prevalence in adults, 2005 UNAIDS/WHO, 2006
Global estimates for adults and children, 2005 • People living with HIV38.6 million[33.4 – 46.0 million] • New HIV infections in 20054.1 million [3.4 – 6.2 million] • Deaths due to AIDS in 20052.8 million[2.4 – 3.3 million]
Global summary of the HIV and AIDS epidemic, 2005 Number of people living with HIV in 2005 Total 38.6 million [33.4 – 46.0 million] Adults 36.3 million [31.4 – 43.4 million] Women 17.3 million [14.8 – 20.6 million] Children under 15 years 2.3 million [1.7 – 3.5 million] Total 4.1 million [3.4 – 6.2 million]Adults 3.6 million [3.0 – 5.4 million]Children under 15 years 540 000 [420 000 – 670 000] Total 2.8 million [2.4 – 3.3 million]Adults 2.4 million [2.0 – 2.8 million]Children under 15 years 380 000 [290 000 – 500 000] People newly infected with HIV in 2005 AIDS deaths in 2005
Regional HIV and AIDS statistics and features, 2003 and 2005 REGION Adults (15+) and children living with HIV Adults (15+) and children newly infected with HIV Adult (15-49) prevalence (%) Adult (15+) and child deaths due to AIDS 2005 2003 2005 2003 2005 2003 2005 2003 Sub-Saharan Africa 24.5 million [21.6‒27.4 million] 23.5 million [20.8‒26.3 million] 2.7 million [2.3‒3.1 million] 2.6 million [2.3‒3.0 million] 6.1 [5.4‒6.8] 6.2 [5.5‒7.0] 2.0 million [1.7‒2.3 million] 1.9 million [1.7‒2.3 million] North Africa and Middle East 440 000 [250 000‒720 000] 380 000 [220 000‒620 000] 64 000 [38 000‒210 000] 54 000 [31 000‒150 000] 0.2 [0.1‒0.4] 0.2 [0.1‒0.3] 37 000 [20 000‒62 000] 34 000 [18 000‒57 000] Asia 8.3 million [5.7‒12.5 million] 7.6 million [5.2‒11.3 million] 930 000 [620 000‒2.4 million] 860 000 [560 000‒2.3 million] 0.4 [0.3‒0.6] 0.4 [0.2‒0.6] 600 000 [400 000‒850 000] 500 000 [340 000‒710 000] Oceania 78 000 [48 000‒170 000] 66 000 [41 000‒140 000] 7200 [3500‒55 000] 9000 [4300-69 000] 0.3 [0.2‒0.8] 0.3 [0.2‒0.7] 3400 [1900‒5500] 2300 [1300‒3600] Latin America 1.6 million [1.2‒2.4 million] 1.4 million [1.1‒2.0 million] 140 000 [100 000‒420 000] 130 000 [95 000‒310 000] 0.5 [0.4‒1.2] 0.5 [0.4‒0.7] 59 000 [47 000‒76 000] 51 000 [40 000‒67 000] Caribbean 330 000 [240 000‒420 000] 310 000 [230 000‒400 000] 37 000 [26 000‒54 000] 34 000 [24 000‒47 000] 1.6 [1.1‒2.2] 1.5 [1.1‒2.0] 27 000 [19 000‒36 000] 28 000 [19 000‒38 000] Eastern Europe and Central Asia 1.5 million [1.0‒2.3 million] 1.1 million [790 000‒1.7 million] 220 000 [150 000‒650 000] 160 000 [110 000‒440 000] 0.8 [0.6‒1.4] 0.6 [0.4‒1.0] 53 000 [36 000‒75 000] 28 000 [19 000‒39 000] North America, Western and Central Europe 2.0 million [1.4‒2.9 million] 1.8 million [1.3‒2.7 million] 65 000 [52 000‒98 000] 65 000 [52 000‒98 000] 0.5 [0.4‒0.7] 0.5 [0.3‒0.6] 30 000 [24 000‒45 000] 30 000 [24 000‒45 000] TOTAL 38.6 million [33.4‒46.0 million] 36.2 million [31.4‒42.9 million] 4.1 million [3.4‒6.2 million] 3.9 million [3.3‒5.8 million] 1.0 [0.9‒1.2] 1.0 [0.8‒1.2] 2.8 million [2.4‒3.3 million] 2.6 million [2.2‒3.1 million]
Adults and children estimated to be living with HIV, 2005 Eastern Europe & Central Asia 1.5 million [1.0 – 2.3 million] Western & Central Europe 720 000 [550 000 – 950 000] North America 1.3 million [770 000 – 2.1 million] East Asia 680 000 [420 000 – 1.1 million] North Africa & Middle East 440 000 [250 000 – 720 000] Caribbean 330 000 [240 000 – 420 000] South & South-East Asia 7.6 million [5.1 – 11.7 million] Sub-Saharan Africa 24.5 million [21.6 – 27.4 million] Latin America 1.6 million [1.2 – 2.4 million] Oceania 78 000 [48 000 – 170 000] Total: 38.6 (33.4 – 46.0) million
Estimated number of adults and children newly infected with HIV, 2005 Eastern Europe & Central Asia 220 000 [150 000– 650 000] Western & Central Europe 22 000 [18 000 – 33 000] North America 43 000 [34 000 – 65 000] East Asia 97 000 [55 000 – 290 000] North Africa & Middle East 64 000 [38 000 – 210 000] Caribbean 37 000 [26 000 – 54 000] South & South-East Asia 830 000 [530 000 – 2.3 million] Sub-Saharan Africa 2.7 million [2.3 – 3.1 million] Latin America 140 000 [100 000 – 420 000] Oceania 7200 [3500 – 55 000] Total: 4.1 (3.4 – 6.2) million
Estimated adult and child deaths from AIDS, 2005 Eastern Europe & Central Asia 53 000 [36 000 – 75 000] Western & Central Europe 12 000 [<15 000] North America 18 000 [11 000 – 26 000] East Asia 33 000 [20 000 – 49 000] North Africa & Middle East 37 000 [20 000 – 62 000] Caribbean 27 000 [19 000 – 36 000] South & South-East Asia 560 000 [370 000 – 810 000] Sub-Saharan Africa 2.0 million [1.7 – 2.3 million] Latin America 59 000 [47 000 – 76 000] Oceania 3400 [1900 – 5500] Total: 2.8 (2.4 – 3.3) million
Children (<15 years) estimated to be living with HIV, 2005 Eastern Europe & Central Asia 6900 [3400 – 14 000] Western & Central Europe 4000 [<8000] North America 11 000 [3500 – 27 000] East Asia 6400 [2000 – 16 000] North Africa & Middle East 31 000 [12 000 – 75 000] Caribbean 22 000 [9800 – 43 000] South & South-East Asia 170 000 [70 000 – 380 000] Sub-Saharan Africa 2.0 million [1.5 – 3.0 million] Latin America 32 000 [19 000 – 59 000] Oceania 3000 [830 – 7900] Total: 2.3 (1.7 – 3.5) million
Estimated deaths in children (<15 years) from AIDS, 2005 Eastern Europe & Central Asia 1200 [620 – 2300] Western & Central Europe <100 [<200] North America <100 [<200] East Asia 1400 [530 – 2700] North Africa & Middle East 4900 [2000 – 9500] Caribbean 3100 [1600 – 5100] South & South-East Asia 29 000 [14 000 – 54 000] Sub-Saharan Africa 330 000 [250 000 – 440 000] Latin America 2900 [1800 – 4900] Oceania 600 [200 – 1800] Total: 380 000 (290 000 – 500 000)
Estimated number of children (<15 years) newly infected with HIV, 2005 Eastern Europe & Central Asia 2300 [1400 – 3900] Western & Central Europe 200 [<400] North America 500 [<1000] East Asia 2300 [1000 – 4100] North Africa & Middle East 6900 [3200 – 12 000] Caribbean 3700 [2100 – 5800] South & South-East Asia 44 000 [23 000 – 75 000] Sub-Saharan Africa 470 000 [370 000 – 590 000] Latin America 5000 [3500 – 8000] Oceania 1100 [400 – 2800] Total: 540 000 (420 000 – 670 000)
Over 11 000 new HIV infections a day in 2005 • More than 95% are in low and middle income countries • About 1500 are in children under 15 years of age • About 10 000 are in adults aged 15 years and older • of whom: • almost 50% are among women • over 40% are among young people (15-24)
Number of people on antiretroviral therapy in low- and middle-income countries, 2002–2005 1400 1200 People receiving therapy (thousands) North Africa and the Middle East 1000 Europe and Central Asia 800 East, South and South-East Asia 600 Latin America and the Caribbean Sub-Saharan Africa 400 200 0 End 2002 Mid- 2003 End 2003 Mid- 2004 End 2004 Mid- 2005 End 2005 Source: WHO/UNAIDS (2005). Progress on global access to HIV antiretroviral therapy: An update on “3 by 5.”
Funding required for prevention Source: UNAIDS (2005). Resource needs for an expanded response to AIDS in low- and middle-income countries.
Funding required for treatment and care, including antiretroviral therapy (ART), in order to achieve the coverage targets shown Source: UNAIDS (2005). Resource needs for an expanded response to AIDS in low- and middle-income countries.
Estimated number of adults and children living with HIV by region, 1986–2005 45 40 Oceania Million 35 North Africa & Middle East 30 Eastern Europe & Central Asia 25 Latin America and Caribbean Number of people living with HIV 20 North America and Western Europe 15 Asia 10 Sub-Saharan Africa 5 0 1985 1990 1995 2000 2005 Year
120 000 105 000 90 000 75 000 60 000 45 000 30 000 15 000 0 Increase in reported HIV cases in the Russian Federation and Ukraine, 1987–2005 Reported HIV cases in the Russian Federation Reported HIV cases in Ukraine 400 000 Russian Federation 350 000 Newly reported cases 300 000 Cumulative (previous years) 250 000 Ukraine 200 000 Newly reported cases 150 000 Cumulative (previous years) 100 000 50 000 0 1987 1989 1991 1993 1995 1997 1999 2001 2003 2005 Sources: Russian Federal AIDS Centre; Ukranian AIDS Centre and Ministry of Health of Ukraine
Diagnosed and Estimated HIV Cases in Ukraine (1987-2005 cumulative data) Source: Ukrainian AIDS Center, 2006
Annual AIDS Cases and Deaths in Ukraine (1991-2005 cumulative data) Cumulative number of AIDS cases – 13,108; AIDS deaths – 7,537 Source: Ukrainian AIDS Center, 2006
Prevalence of HIV Infection per 100,000 by Region – Ukraine, 2005 (based on the official case reporting) Source: Ukrainian AIDS Center, 2006
Distribution of Newly Registered Cases of HIV/AIDS by Age Group – Ukraine, 2005 (based on the official case reporting)
Newly registered HIV infections by sex and place of residence – Ukraine, 2005
Number of HIV tests and registered HIV-positive cases in Ukraine (1993-2004) Source: Ukrainian AIDS Center, 2005
Number of HIV-positive cases among IDUs in Ukraine (1994- June 2006) Source: Ukrainian AIDS Center, 2006
Proportion of HIV-infected women and children born to women with HIVin Ukraine (%) (1987-2005) Source: Ukrainian AIDS Center, 2006
Modes of Transmission of HIV-Infection in Ukraine • Intravenous Drug Use • From mother to child • Sexual Transmission • Undetermined Source: Ukrainian AIDS Centre, 2005
222 265 585 228 549 301 N Number of patients on ART treatment Source: Ukrainian AIDS Centre, 2005
Implementation of ART in Ukraine (2004-2006) Source: Ukrainian AIDS Centre, 2005
Assessing Ukraine’s National Response to HIV/AIDS:Ukraine’s 2006 UNGASS Report (Prevention) • Percentage of schools with teachers who have been trained in life-skills-based HIV/AIDS education and who taught it during the last academic year was 55% in 2004. • Percentage of large enterprises/companies that have HIV/AIDS workplace policies and programs was 0% in 2004. • Percentage of HIV-infected pregnant women receiving a complete course of ARV prophylaxis to reduce the risk of MTCT was 86% in 2004. Source: UKRAINE - National Report on the Follow-up to the UNGASS Declaration of Commitment on HIV/AIDS (2005)
Assessing Ukraine’s National Response to HIV/AIDS:Ukraine’s 2006 UNGASS Report (care and treatment) • Percentage of patients with STIs at state-owned and communal health care facilities, who were appropriately diagnosed, treated and counselled was 100% in 2004. • Percentage of people with advanced HIV infection who received combination ARV therapy in 2004 was 41,73% (1,299 people). Source: UKRAINE - National Report on the Follow-up to the UNGASS Declaration of Commitment on HIV/AIDS (2005)
Assessing Ukraine’s National Response to HIV/AIDS:Ukraine’s 2006 UNGASS Report (knowledge level / behavior) • Percentage of young people aged 15-24 who both correctly identify ways of preventing the sexual transmission of HIV and who reject major misconceptions about HIV transmission was 23% in 2004 (Target: 90% by 2005; 95% by 2010). • Percentage of young people aged 15-24 years reporting the use of a condom during sexual intercourse with a non-regular sexual partner was 69% in 2004. • Percentage of IDUs who have adopted behaviors that reduce transmission of HIV was 20% in 2004. Source: UKRAINE - National Report on the Follow-up to the UNGASS Declaration of Commitment on HIV/AIDS (2005)
Summary of scenario outcomes for progression of HIV/AIDS Epidemic in Ukraine, 2014 Source: World Bank and International HIV/AIDS Alliance, Socioeconomic Impact of HIV/AIDS Epidemic in Ukraine, 2006
Modelling Macroeconomic Impact of HIV/AIDS Epidemic in Ukraine Impact on labour force: • Estimated to be an 11.6% reduction by 2014 due to the demographic decline • Additional reduction in labor force participation is caused by the HIV/AIDS • An 1–2 % reduction in 2014 on the national level; • Much higher reduction in the worst affected regions, i.e. 2.7–3.6 % in Donetsk oblast and 2.2–4.2% in Odesa oblast Impact on budget: • Additional annual HIV/AIDS treatment expenditureincluding ARV will reach630 mlnUAH • Annual budget revenue losses through unpaid taxes and levies(pension fund and social security fund covering temporary disability and unemployment) may reach 418 mln UAH Source: World Bank and International HIV/AIDS Alliance, Socioeconomic Impact of HIV/AIDS Epidemic in Ukraine, 2006
Modelling Macroeconomic Impact of HIV/AIDS Epidemic in Ukraine Main mid-term effects: (by 2014 with AIDS, compared to the no-AIDS baseline scenario): • 1-6% reduction in the level of output (GDP in constant prices); • 2-8% reduction in total welfare; • 1-9% reduction in investment; and • 3-9% reduction in total exports • labour-intensive sectors whose labour inputs suffer from the epidemic are among the worst affected • Production of non-energy materials • Metallurgy and metal processing Source: World Bank and International HIV/AIDS Alliance, Socioeconomic Impact of HIV/AIDS Epidemic in Ukraine, 2006
Stigma and discrimination • Association of HIV/AIDS with behaviours that may be considered socially unacceptable by many people • Stigma and discrimination constitute one of the greatest barriers to dealing effectively with the epidemic • They discourage governments from acknowledging or taking timely action against AIDS. • They deter individuals from finding out about their HIV status and seek support and care. • They inhibit those who know they are infected from sharing their diagnosis and taking action to protect others and from seeking treatment and care for themselves. • Strong movement of people living with HIV that affords mutual support and a voice at local and national levels is particularly effective in tackling stigma. • The presence of treatment makes this task easier too
Conclusion: Key Messages • Ukraine has most intense AIDS epidemic in Europe • Epidemic continues to progress among and beyond at-risk populations • Coverage and intensity of most existing programmes are not having impact on epidemic • AIDS will have significant and growing socio-economic impact in Ukraine
Conclusion: Key Messages (cont.) • To defeat HIV and AIDS, we need to reduce the number of people who become infected • Prevention is still the only “cure” we have for HIV/AIDS • All and everyone need to get involved!
Thank you! Дякую!