Download
1 / 25
270 likes | 298 Views
Explore the features and transformations of sinusoidal curves for modeling periodic phenomena. Learn key terms and equations related to trigonometric functions. Practice analyzing and graphing sinusoidal equations. Solve problems involving periodic phenomena in real-life situations.

E N D
Lesson 27 – Graphs of Trigonometric Functions IB Math HL Math HL
Lesson Objectives • 1. Relate the features of sinusoidal curves to modeling periodic phenomenon • 2. Transformations of sinusoidal functions and their features Math HL
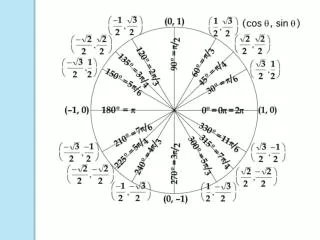
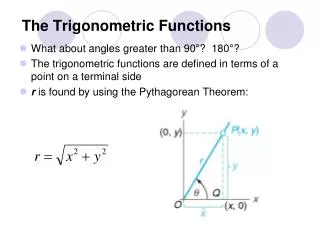
(A) Key Terms • Define the following key terms that relate to trigonometric functions: • (a) period • (b) amplitude • (c) axis of the curve (or equilibrium axis) • (d) phase shift or phase angle Math HL
(A) Key Terms Math HL
The General Sinusoidal Equation • In the equation f(x) = asin(k(x+c)) + d, explain what: • a represents? • k represents? • c represents? • d represents? Math HL
Modeling Periodic Phenomenon • The graph shows John’s height above the ground as a function of time as he rides a Ferris wheel. • (a) State the maximum and minimum height of the ride. • (b) How long does the Ferris wheel take to make one complete revolution? • (c) What is the amplitude of the curve? How does this relate to the Ferris wheel? • (d) Determine the equation of the axis of the curve. Math HL
Modeling Periodic Phenomenon • A spring bounces up and down according to the model d(t) = 0.5 cos 2t, where d is the displacement in centimetres from the rest position and t is the time in seconds. The model does not consider the effects of gravity. • (a) Draw the graph. • (b) Explain why the function models periodic behaviour. • (c) What is the period and what does it represent in the context of this question? • (d) What is the amplitude and what does it represent in the context of this question? Math HL
Modeling Periodic Phenomenon • A small windmill has its center 6 m above the ground and the blades are 2 m in length. In a steady wind, one blade makes a rotation in 12 sec. Use the point P as a reference point on a blade that started at the highest point above the ground. • (a) Determine an equation of the function that relates the height of a tip of a blade, h in meters, above the ground at a time t. • (b) What is the height of the point P at the tip of a blade at 5s? 40s? • (c) At what time is the point P exactly 7 m above the ground? Math HL
Analysis of Sinusoidal Graphs • (a) Determine the maximums and zeroes of the function f(x) = -2sin(2x-60°)+1 • (b) Determine the equation of the asymptotes and zeroes of the function • (c) Determine the period and the equation of the axis of the curve of Math HL
Analysis of Systems of Trig Functions • (a) Sketch y = sin(2x-π), given the domain of [0,2π] • (b) Sketch y = cos(x), given the same domain • (c) Provide a solution to the equation sin(2x-π) = cos(x) Math HL
Working with Graphs of the Secondary Trig Functions • (a) Sketch 2 cycles of the graph of y = sin(x) • (b) Hence, sketch y = csc(x) & label key features (asymptotes, max/min, x- & y-int) • (c) Hence, sketch 2 cycles of y = 2csc(2x) – 4 and label key features (asymptotes, max/min, x- & y-int. Math HL
Working with Graphs of the Secondary Trig Functions • (a) Sketch a graph of two periods of f(x) = 2 + cos(x) • (b) Sketch a graph of two periods of g(x) = -sec(x) • (c) How many solutions would you predict for the system f(x) = g(x)? Find the exact values of these solutions Math HL
Advanced Sinusoidals • (a) Use your GDC to graph f(x) = |sin(x)| on [-2π,4π] • (b) State the 6 maximums of y = f(x) • (c) Now graph g(x) = e-0.1xf(x) • (d) Determine the 6 maximums of y = g(x) • (e) Now graph y = e-0.1x • (f) Explain what y = e-0.1x does to the sinusoidal function. • (g) Explain what dampened simple harmonic motion is Math HL
Advanced Sinusoidals • Predict the domains of the following composite functions Math HL
Sinusoidals: f(x) = Asin(x) + Bcos(x) • (a) Graph the function • (b) This function can be rewritten in the form . Determine the values of K and α. • (c) Determine the value of Math HL
Sinusoidals: f(x) = Asin(x) + Bcos(x) • (a) Graph the function • (b) This function can be rewritten in the form . Determine the values of K and α. • (c) Determine the value of Math HL
Sinusoidals: f(x) = Asin(x) + Bcos(x) The function can be rewritten in the form Predict the values of K and α, based upon the connections you established in your previous work on the previous 2 slides Test your conjecture by rewriting Math HL
Review of Inverse Functions • Q What is the significance of a function being 1:1 in the context of inverse functions? • Q Is f(x) = x2 a 1:1 function? • Q How did we “resolve” this issue with the function f(x) = x2? Precalculus - Santowski
Restricted Domains • (a) How would you restrict the domain of g(x) = sin(x) so that its inverse is a function? Use your calculator to justify your choice. (numerically & graphically) • (b) How would you restrict the domain of g(x) = cos(x) so that its inverse is a function? Use your calculator to justify your choice. (numerically & graphically) • (c) How would you restrict the domain of g(x) = tan(x) so that its inverse is a function? Use your calculator to justify your choice. (numerically & graphically) Precalculus - Santowski
Graphs of Trig Inverse Functions: x = sin(y) Precalculus - Santowski
Graphs of Trig Inverse Functions: y = sin-1(x) Precalculus - Santowski
Graphs of Trig Inverse Functions: x = cos(y) Precalculus - Santowski
Graphs of Trig Inverse Functions: y = cos-1(x) Precalculus - Santowski
Graphs of Trig Inverse Functions: x = tan(y) Precalculus - Santowski
Graphs of Trig Inverse Functions: y = tan-1(x) Precalculus - Santowski