Strategic Analysis for Long-Term Profitability in Global Beverage Industry
Explore internal performance metrics and strategic implications for long-term profitability in the global beverage sector. Learn how to assess customer satisfaction, brand loyalty, product quality, and more to develop responsive strategies.

Strategic Analysis for Long-Term Profitability in Global Beverage Industry
E N D
Presentation Transcript
Chapter Six Internal Analysis
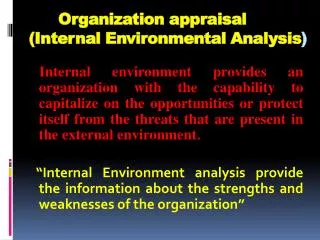
p. 91, second paragraph • Just as strategy can be developed at the level of the business, a group of businesses, or the firm, internal analysis can also be conducted at each of these levels. Of course, analyses at different levels will differ from each other in emphasis in content, but their structure and thrust will be the same. The common goal is to identify organizational strengths, weaknesses, and constraints and, ultimately, to develop responsive strategies, either exploiting strengths or correcting or compensating for weaknesses.
To paraphrase… • How are we doing? If we are doing well, how can we do more of it? If we are not doing well, how can we fix it, or at least minimize it.
How do we define the business? • Hawaii • Western U.S. • U.S. • North America • Global
How do we define the business? • Packaged • Fountain
How do we define the business? • Cans • Bottles • 6 pack • 12 pack • 24 pack
How do we define the business? • Restaurants • C-stores • Movies • Others
How do we define the business? • Coke • Diet Coke • Sprite • Fanta • Mr. Pibb • Other
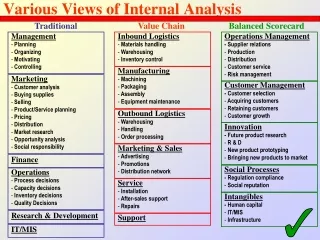
Financial Performance – Sales and Profitability • Sales and Market Share • Profitability • Measuring Performance: Shareholder Value Analysis
Market Share Total Sales Total Market Sales
Market Share Total Sales Total Market Sales
Profitability • Profit • Profit Margin • Asset Turnover • R.O.A. (return on assets)
Profit • Bottom line on the P&L
Profit Margin • Profit divided by sales
Asset Turnover • Sales divided by average total assets
R.O.A. • Profit margin times asset turnover
Calculate • Profit Margin • Asset turnover • Return on Assets
Shareholder Value Analysis • Cost of equity—weighted average of cost of capital and cost of debt • e.g. Capital $1 billion (12%); Debt $3 billion (4%) then the cost of capital is 6% • Each business aims at ROA to exceed cost of equity so shareholder can improve stock investment
Shareholder Value Risks • ROA estimate requires knowing the cash flow of any investment and the assets employed—could encourage short term results • Reducing assets employed by outsourcing could result in loss of control of business • Reducing investment could affect offering • Increasing debt to reduce cost of equity could be risky Chapter 6 - Internal Analysis
Chapter Six Internal Analysis Part Two
Performance Measures ReflectingLong-Term Profitability Customer Satisfaction/ Brand Loyalty Long Term Profits Product/Service Quality Current Performance Brand/Firm Associations Relative Cost New Product Activity Manager/Employee Capability/Performance Heritage and Values Chapter 6 - Internal Analysis Figure 6.1
Performance Measures ReflectingLong-Term Profitability Customer Satisfaction/ Brand Loyalty Long Term Profits Product/Service Quality Current Performance Brand/Firm Associations Relative Cost New Product Activity Manager/Employee Capability/Performance Heritage and Values Chapter 6 - Internal Analysis Figure 6.1
Performance Measures ReflectingLong-Term Profitability Customer Satisfaction/ Brand Loyalty Long Term Profits Current Performance Product/Service Quality Brand/Firm Associations Relative Cost New Product Activity Manager/Employee Capability/Performance Heritage and Values Chapter 6 - Internal Analysis Figure 6.1
Performance Measures ReflectingLong-Term Profitability Customer Satisfaction/ Brand Loyalty Long Term Profits Product/Service Quality Current Performance Brand/Firm Associations Relative Cost New Product Activity Manager/Employee Capability/Performance Heritage and Values Chapter 6 - Internal Analysis Figure 6.1
Performance Measures ReflectingLong-Term Profitability Customer Satisfaction/ Brand Loyalty Long Term Profits Product/Service Quality Current Performance Brand/Firm Associations Relative Cost New Product Activity Manager/Employee Capability/Performance Heritage and Values Chapter 6 - Internal Analysis Figure 6.1
More Expensive Inferior Superior Less Expensive Relative Cost vs. Relative Performance - Strategic Implications • Change • Design • Manufacturing/Systems • Ignore • Value Analysis • Raise prices • Promote • Cost Reduction Our Component is • Value Analysis • De-emphasize • Upgrade • Value Analysis • Emphasize/promote • Leave it alone Chapter 6 - Internal Analysis Figure 6.2
More Expensive Inferior Superior Less Expensive Relative Cost vs. Relative Performance - Strategic Implications • Change • Design • Manufacturing/Systems • Ignore • Value Analysis • Raise prices • Promote • Cost Reduction Our Component is • Value Analysis • De-emphasize • Upgrade • Value Analysis • Emphasize/promote • Leave it alone Chapter 6 - Internal Analysis Figure 6.2
More Expensive Inferior Superior Less Expensive Relative Cost vs. Relative Performance - Strategic Implications • Change • Design • Manufacturing/Systems • Ignore • Value Analysis • Raise prices • Promote • Cost Reduction Our Component is • Value Analysis • De-emphasize • Upgrade • Value Analysis • Emphasize/promote • Leave it alone Chapter 6 - Internal Analysis Figure 6.2
More Expensive Inferior Superior Less Expensive Relative Cost vs. Relative Performance - Strategic Implications • Change • Design • Manufacturing/Systems • Ignore • Value Analysis • Raise prices • Promote • Cost Reduction Our Component is • Value Analysis • De-emphasize • Upgrade • Value Analysis • Emphasize/promote • Leave it alone Chapter 6 - Internal Analysis Figure 6.2
More Expensive Inferior Superior Less Expensive Relative Cost vs. Relative Performance - Strategic Implications • Change • Design • Manufacturing/Systems • Ignore • Value Analysis • Raise prices • Promote • Cost Reduction Our Component is • Value Analysis • De-emphasize • Upgrade • Value Analysis • Emphasize/promote • Leave it alone Chapter 6 - Internal Analysis Figure 6.2
Performance Measures ReflectingLong-Term Profitability Customer Satisfaction/ Brand Loyalty Long Term Profits Product/Service Quality Current Performance Brand/Firm Associations Relative Cost New Product Activity Manager/Employee Capability/Performance Heritage and Values Chapter 6 - Internal Analysis Figure 6.1
Performance Measures ReflectingLong-Term Profitability Customer Satisfaction/ Brand Loyalty Long Term Profits Product/Service Quality Current Performance Brand/Firm Associations Relative Cost New Product Activity Manager/Employee Capability/Performance Heritage and Values Chapter 6 - Internal Analysis Figure 6.1
Performance Measures ReflectingLong-Term Profitability Customer Satisfaction/ Brand Loyalty Long Term Profits Product/Service Quality Current Performance Brand/Firm Associations Relative Cost New Product Activity Manager/Employee Capability/Performance Heritage and Values Chapter 6 - Internal Analysis Figure 6.1