Download
1 / 20
210 likes | 351 Views
Ensemble Methods and tools. Tara L. Jensen , Barbara Brown, John Halley Gotway , Tressa Fowler and Randy Bullock National Center for Atmospheric Research, Boulder Colorado, USA and Developmental Testbed Center, Boulder Colorado, USA.

E N D
Ensemble Methods and tools Tara L. Jensen, Barbara Brown, John Halley Gotway, Tressa Fowler and Randy Bullock National Center for Atmospheric Research, Boulder Colorado, USA andDevelopmental Testbed Center, Boulder Colorado, USA 6th NCEP Ensemble Users Workshop, 25-27 March 2014 °NCWCP, Maryland
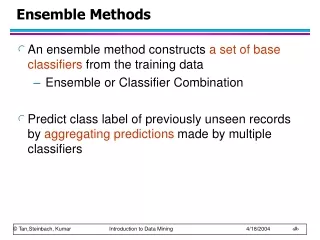
Overview • Tools • Methods • New Research
R Statistics • R ~ the dominant language in the statistical research community. • R is Open Source and free. • Runs on most operating systems • Nearly 2,400 packages contributed. Good for point probability forecasts Struggles with large gridded files • SpatialVx • Rgis, spatstat (GIS) • ncdf ( support for netcdf files ) • rgdal (support for grib1 files) • rNOMADS (support for grib2 files archived by NCEP) • Rcolorbrewer • randomForests Some useful packages • verification • fields (spatial stats) • radiosondes • extRemes • BMA(Bayesian Model Averaging) • BMAensemble • circular • Rsqlite
Model EVALUATION TOOLS (MET) Input Reformat Statistics Analysis Gridded GRIB Input: Observation Analyses Model Forecasts Gen Poly Mask NetCDF Mask MODE ASCII NetCDF PS MODE Analysis ASCII PCP Combine Gridded NetCDF Wavelet Stat STAT ASCII NetCDF PS Grid Stat STAT ASCII NetCDF ASCII Point Obs ASCII2NC Stat Analysis ASCII Ensemble Stat STAT ASCII NetCDF PrepBufr Point Obs PB2NC NetCDF Point Obs Point Stat STAT MADIS Point Obs MADIS2NC = optional Developed by the Developmental Testbed Center, Boulder Colorado, USA
MET capabilities Ensemble Characteristics (Ensemble Stat) Probability Measures (Grid and Point stat) Brier Score + Decomposition Brier Skill Score ROC and Area Under ROC Reliability • Rank Histogram • PIT • CRPS • Ignorance Score • Spread-Skill
New in MET: Series Analysis toolgeographic representation of scores
Object Oriented Method: MODEHow it works • Matched Object 1 • Matched Object 2 • Unmatched Object ENS FCST OBS Radius=5 ObjectThresh>6.35 mm MergingThresh>5.7 mm Radius=5 ObjectThresh>6.35 mm MergingThresh> 5.7 mm Merging Merging Matching No false alarms Misses
QPE_06 >12.7 mm vs. 50% Prob(APCP_06>12.7 mm) Good Forecastwith DisplacementError? TraditionalMetrics Brier: 0.07 Area UnderROC: 0.62 Spatial Metrics Centroid Distance: Obj1) 200 km Obj2) 88km Area Ratio: Obj1) 0.69 Obj2) 0.65 1 Obj PODY: 0.72 Obj FAR: 0.32 2
MODE for Different Probabilities – May 11, 2013 NWS PoP - Percent chance that rain will occur at any given point in the area. Intersection Area Forecast Area 22,600 0.61 0.58 21,500 SymmetricDifference (non-intersecting area) 0.36 1,050 6,500 0.11 22,200 0.75 19,400 0.41 23,006 0.35 Prob>2.54 mm >50% Prob>2.54 mm >25% Observation NWS PoP= C x A where "C" = the confidence that precipitation will occur somewhere in the forecast area "A" = the percent of the area that will receive measureable precipitation. 16,600 0.72 Forecast Prob>2.54 mm >75%
As probabilities: Areas do not have “shape” of precipitation areas; may “spread” the area As mean: Area is not equivalent to any of the underlying ensemble members Applying spatial methods to ensembles
ExampleMay 11, 2013 Matched Observed Object No Ensemble Mean Matched Ensemble Mean Matched Forecast Object Unmatched Observed Object Unmatched Forecast Object
IndividualMATCHED OBSERVED OBJECTs 2 1 3 4 5
median Fcst Matched Forecast Area (grid squares) Obs Object Areas Some observed objects do not have ensemble means matched – this may be good information to have 4 1 3 2 5
May 2013: 27 Days of Matched Observed/Forecast Pairs FORECAST AREA Dominated by 1 member Matched Forecast Area (grid squares) Mean appears to be middle of attribute distribution High bias on forecast area. Sometimes ensemble mean is in middle of attribute distribution and sometimes is it dominated by 1 member
What Next? • Now that we have ability to keep track of all member objects paired with observed objects • Rank Histograms of individual attributes (i.e. area, centroid latitude, longitude, complexity) • Distribution of Attributes • Individual attributes may be used prognostically • Paired Forecast-Observed attributes used diagnostically • Summary with Inner Quartile Range • Spread-Skill diagrams • Diagnostic Analysis • How many ensemble means are not matched even though members are indicating the event may occur • Evaluation of probability fields using MODE objects in new ways
Thank You DTC: http://www.dtcenter.org MET: http://www.dtcenter.org/met/users MET HELP: met_help@ucar.edu Email: jensen@ucar.edu