Download
1 / 16
160 likes | 288 Views
Object-Oriented Best Member Selection in a Regional Ensemble Forecasting System. Christian Keil and George Craig Institut für Physik der Atmosphäre DLR Oberpfaffenhofen, Germany. Regional Ensemble Prediction System. COSMO-LEPS regional ensemble (ARPA SMR)

E N D
Object-Oriented Best Member Selection in a Regional Ensemble Forecasting System Christian Keil and George Craig Institut für Physik der Atmosphäre DLR Oberpfaffenhofen, Germany
Regional Ensemble Prediction System • COSMO-LEPS regional ensemble (ARPA SMR) • Identify ten clusters from ECMWF 51 member ensemble • Use a representative member from each cluster to drive a regional model (DWD Lokal Model) • To make use of forecast ensemble, need to weight members • equally probable • use cluster populations, or • use most recent data (e.g. satellite imagery) But, for local severe weather, phase errors may dominate, so use a nonlinear pattern recognition algorithm
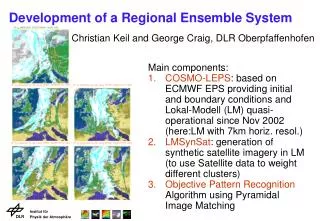
Regional Ensemble Prediction System • Main components: • COSMO-LEPS: based on ECMWF EPS providing initial and boundary conditions and Lokal-Modell (LM Δx=7km) • LMSynSat: forward operator to compute synthetic satellite imagery in LM • 3.Objective Pattern Recognition Algorithm using Pyramidal Image Matching
COSMO-LEPS case-study: 9 July 2002 Clustering of 1 EPSs fc range +48..60h (2002070912-00) using 4 discriminating variables at 3 pressure levels (u,v,Φ,q at 500/700/850 hPa): Clustering method -----> COMPLETE LINKAGE Selection mode --------> MINIMIZE INT/EXT RATIO Ensemble --------------> 1 Initial Date ----------> 2002 7 7 12 UTC Forecast range (hours) -> 48 - 60 Area Limits (N/S/W/E) --> 60.0 30.0 -10.0 30.0 Number of clusters ----> 10 Explained Variance(%) -> 42.8 Cluster ---------------> 1 2 3 4 5 6 7 8 9 10 Size ------------------> 6 8 10 6 6 4 4 5 1 1 Internal variance(%) --> 5.8 9.8 12.3 6.9 6.8 4.6 4.6 6.5 .0 .0 Radius -----------------> 12.3 13.8 13.8 13.3 13.3 13.4 13.4 14.2 .0 .0 CL 1: ( 5) 0 5 17 24 40 41 CL 2: ( 1) 1 4 9 11 18 32 33 49 CL 3: ( 31) 2 3 10 12 26 28 31 34 46 50 CL 4: ( 39) 6 16 22 29 39 42 CL 5: ( 43) 7 13 36 38 43 48 CL 6: ( 45) 8 25 27 45 CL 7: ( 44) 14 35 37 44 CL 8: ( 15) 15 20 21 30 47 CL 9: ( 19) 19 CL 10: ( 23) 23
Generation of synthetic satellite images in LM: LMSynSat • RTTOV-7 radiative transfer model (Saunders et al, 1999) • Input: 3D fields: T,qv,qc,qi,qs,clc,ozone • surface fields: T_g, T_2m, qv_2m, fr_land • Output: cloudy/clear-sky brightness temperatures for • Meteosat7 (IR and WV channels) and • Meteosat8 (eight channels) (Keil et al, 2005)
Case Study with COSMO-LEPS: 9 July 2002 Meteosat 7 IR 16:00 UTC Lokal Modell: all 10 clusters
Pyramidal Image Matching • Project observed and simulated images to same grid • Coarse-grain both images by pixel averaging, then compute displacement vector field that minimizes the total squared error in brightness temperature; • search area +/- 2 pixel elements • 3.Repeat step 2 at successively finer scales • 4. Displacement vector for every pixel results from the sum over all scales
Image Matching: BT< -20°C and coarse grain Meteosat 7 IR 1 Pixelelement = 8x8 LM GP
Image Matching: BT< -20°C and coarse grain Observed Model Cluster 7
DisplacementVectors Image Matching: BT< -20°C and coarse grain Observed Model Cluster 7
Ranking using different Quality Measures • Rank 1 2 3 4 5 6 7 8 9 10 corr. • subjective2 10 4 7 9 1 5 6 8 3 0.85 • new measure 7 2 9 4 10 1 8 6 3 5 0.77 • population 3 2 4 1 5 7 6 8 9 10 -0.34 • Magnitude of displacement vectors consistent with subjective ranking • Cluster population shows no correlation
A new Quality Measure FQI = 0.33 * [ nordispl + (1-LM/Sat)+ + (1-corr)] bad good
Conclusions • Pyramidal image matching provides a plausible measure of forecast error (consistent with subjective rankings) • COSMO-LEPS cluster populations are a poor indicator of local skill • Persistence of skill for about 12 hours owing to change of weather regime in region Future: adaptive forecasting system: stochastic physics, assimilation of MSG and radar data