Advanced Disaster Management Using Data Fusion and Visualization Techniques
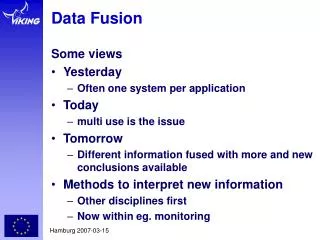
This project encompasses innovative methods for visualizing and managing disaster responses, specifically in earthquake scenarios. By integrating high-level data fusion with virtual reality techniques, we develop a detailed road network visualization that optimizes ambulance routing and enhances situational awareness. Dynamic symbology and seamless visualization enable emergency responders to retrieve critical information effortlessly. The system provides real-time insights into casualties, medical facilities, and dispatch routes, improving overall disaster response efficiency through a user-friendly interface and advanced algorithms.

Advanced Disaster Management Using Data Fusion and Visualization Techniques
E N D
Presentation Transcript
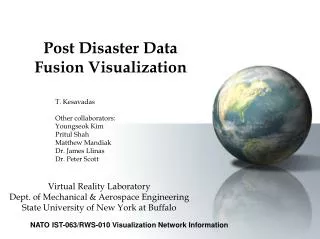
Post Disaster Data Fusion Visualization T. Kesavadas Other collaborators: Youngseok Kim Pritul Shah Matthew Mandiak Dr. James Llinas Dr. Peter Scott Virtual Reality Laboratory Dept. of Mechanical & Aerospace Engineering State University of New York at Buffalo NATO IST-063/RWS-010 Visualization Network Information
Preview Outline • Earthquake disaster • HLA/RTI • Detailed road network with street information • Visualization of Ambulance routes • Retrieval of ambulance route with mouse hovering • Dynamic Symbology • Implemented cell morphing between multiple cluster reports • Seamless visualization • Modified visualization ability for casualty and hospital info.
Federates of HLA-RTI • Report generator (from HAZUS) • Walk-in Casualty (WC) • Medical Facility (MF) • Dispatcher and Router (DR) • Visualization (VZ) • DF – L1 and L2
Ground Truth Database Sys. Estimator Database Run-time Networked Visualization Run-time Network Location of Visualization Federate in HLA/RTI Interface
Run-time Networked Visualization Data Layering in Visualization Casualties Police Ambulances Casualty cluster Ambulance Route HLA / RTI Report Generator GUIs GIS DataBase Display Options Fast Identification Time-aggregation Info. GUI Map Raw Data User
Common Container • Database from Federates • Display option data Win GUI • Linear Clock Objects • Directory Watcher GUI Architecture GUI Architecture Raw Data for Display Map Data for Display GDI+ Library CsGL Library Timer 3D Display 2D Display User
GUI Architecture - Implementation 2D view of Northridge Area Corresponding 3D view Actual implementation of multiple display visualization system
GUI: Northridge Area Console Window Features Time scope for the reports in a specific time span. Only the reports in the time scope are shown in the display. Control to adjust the time-span. Dots represent reports coming in. Scale bars automatically adjust to the current display setting. Setting for Simulation Time
GUI: Northridge Area Map Options CA NY Northridge In order to prevent distraction to the user, control is provided for the GIS map as well as satellite images Color Map Gray-Scale Satellite Image
Allows navigation about casualties, ambulances, police, etc. Provides a better idea of space relation amongst each federate objects. Can visualize incidents that includes height, such as casualties in buildings. Can be incorporated with building data, other landmarks or toxic plume. 3D Environment for Northridge Area GUI: Northridge Area
Dynamic Array of Reports : Collection of all federate Reports Route Report xxx : Collection of Route Report Time Route 1 Coll. of Segments Route 2 Route --- - Route Data - Route Data - Route Data Road Links : Collection of Link Link Index xx Link Index xx Link Index xx Link Index xx ---- ---- Link Index xx Link Index xx Link Index xx Link Index xx ---- ---- Link Index xx Link Index xx Link Index xx Link Index xx ---- ---- Road Link xxx Road Link --- Id, Node Id, Street name etc. Id, Node Id, Street name etc. Road Network for Ambulance route Dispatch/Routing • To improve performance, in place of storing link Id, each index is • stored in a “Collection of Link” database • Binary search algorithm is implemented to find link index from its collection base • Hierarchical database structure used for optimum performance
Route display with mouse hovering Dispatch/Routing Data like Length of Route, Link id and Street name at mouse tip etc., can be retrieved for Ambulance route with Mouse hovering
Higher Level Visualization of Fused Info from Data from Network Fusion Levels Fast GIS Vector Map • GIS Data Acquisition from Arc View • Vector Map Generation and User Interfaces Level 1 Position, Identification • Visualization of HLA / RTI Report (On-line) • • Data of Report Generator • • Implemented in UTM Coordinate • • Symbolic Visualization with GUI for Federates • Integration of Visualization code with HLA/RTI Level 2 Situation Awareness • Visualization for High Level Fusion • • Dynamic Symbology • • Display of Seamless Transition – Cluster Morphing • Ambulance Routing Level 3 Threat Assessment
L2 and L3 concepts • Dynamic Symbology • Dynamic Symbology is a parameterized symbol system in which the values of symbolic entities and graphical properties are generated/calculated in runtime. • Goal: System Automation, Flexibility • No need to maintain large number of fixed symbol sets
Dynamic Symbology • Automation • Tactical symbols and graphics are generated by composing its components. • Flexibility • Symbols/graphics images are not pre-defined, but generated at run-time. Display can be changed dynamically to fit a user’s need during the simulation. Tactical Symbol Components Tactical Graphics Components
Dynamic Symbology • Controlling Visual Effects • Can be used for various visual effects and human factors • Example: Uncertainty visualization with blurred symbol Uncertainty 50 % • 100 Levels of degraded images are generated from only one icon image • Dynamically generated at run time • saves time of manual image processing Uncertainty 0 %
Tactical Graphics • Current visualization is for location & identification of each casualty from RTI reports. • However, with a large number of similar icons, information is usually overloaded with cluttered and overlapped icons. • Grouping can be an efficient Tactical Graphics • Grouping: Proposed Solution Identification (Lower Fusion Level) Seamless Transition Situation Awareness (Higher Fusion Level)
Size of cluster cells may differ between clusters The report handler reads cell data in a cluster message. Two main properties of cluster Severity levels: Colors Total number of casualty: Intensity Properties in text format can also be retrieved quickly by mouse hovering (see figure). Cluster Visualization Clusters by Cells
Cluster represents local group of casualties for effective visualization Recognition of property Colors (hue) for severity levels Intensity (opacity) for total number of casualties Recognition of region: By Cells (Current RTI report) By boundary also considered Cluster Visualization Visualization of Casualty Clusters
The cluster report received from HLA/RTI contains listed data to left in text string This information read in by visualization and stored for use Cluster Visualization Design of Custer Data • Cluster Ident • Time • Cluster ID • Cell Count • Cell Side • Cell IDs • For Each Cell • - X- Position • - Y- Position • - # of Casualties Sev-2 • - # of Casualties Sev-3
Cluster Visualization Rendering Scheme • Based on information provided, each cell rendered as rectangle • As mentioned, the color represents severity level and opacity the number of casualties • Figure below represents a hypothetical scenario High Level of Casualties Few Casualties
Cluster Visualization Morphing of Cluster by Cells • Since difficult to keep track of clusters between • reports, can morph cells which comprise clusters • Seamless Transition is Effective for Situation Awareness (SA) or higher level fusion • Simulation of property changes from one situation to another • Can be achieved by interpolation of properties • Spatial: Corresponding cells • Color: RGB value
Cell Morphing Cluster Visualization by Cell Morphing Timer Scope • First and Last slide represent report points for cluster • Middle three slides show morphing which occurs when scope dragged from first to second point Second Report Point First Report Point
Seamless Transition: Visualization of Casualty Groups Severity of Casualties Level 1 Level 2 Level 3 Raster map + Casualty groups
Visualization of Casualty Groups Removed the realism of raster map
Visualization of Casualty Groups The overlapped regions in purple can be regarded as dense areas. Level 3 groups (in red) added
Visualization of Casualty Groups Added the context of raster map
Future Work • Incorporate data layer with non-fused data • Updating of current Police and Ambulance position to display at all times • More functionality on 3D urban environment • Visualization of roadway damage and pertinent hospital information (capacity) • Inclusion of toxic spill or chemical plume visualization • Bidirectional data interface for later performance evaluation • data sink: as an information terminal • data source: user’s preferences/actions
Distributed Data Fusion Test-bedThe UB Network Centric Warfare Simulator