
Uploaded by
mercer
1 SLIDES
177 VIEWS
10LIKES
4000 m
DESCRIPTION
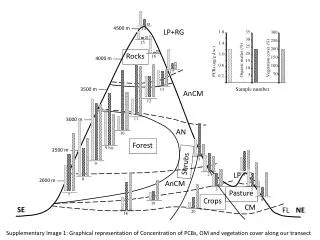
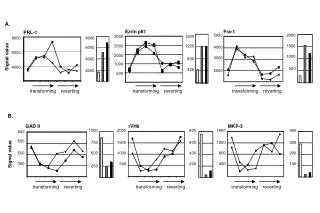
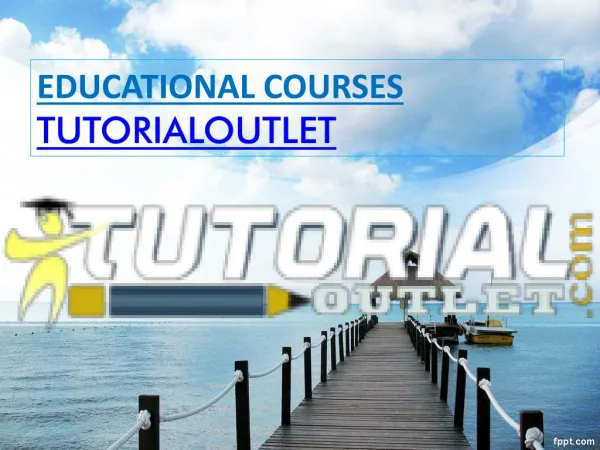
14. 15. 13. 12. 16. 11. 1. 20. 3. 4. 5. 18. 19. 2. 17. 1.8. 35. 300. 30. 250. 1.4. 25. 200. 20. 1.0. Vegetation cover (%). 150. Organic matter (%). PCBs (ng/g d.w. ). 15. 0.6. 100. 10. 50. 5. 0.2. 7. 6. 8. 9. 9 bis. 10. Sample number. LP+RG. 4000 m.
Download
1 / 1
Download Presentation 
4000 m
An Image/Link below is provided (as is) to download presentation
Download Policy: Content on the Website is provided to you AS IS for your information and personal use and may not be sold / licensed / shared on other websites without getting consent from its author.
Content is provided to you AS IS for your information and personal use only.
Download presentation by click this link.
While downloading, if for some reason you are not able to download a presentation, the publisher may have deleted the file from their server.
During download, if you can't get a presentation, the file might be deleted by the publisher.
E N D
Presentation Transcript
14 15 13 12 16 11 1 20 3 4 5 18 19 2 17 1.8 35 300 30 250 1.4 25 200 20 1.0 Vegetation cover (%) 150 Organic matter (%) PCBs (ng/g d.w.) 15 0.6 100 10 50 5 0.2 7 6 8 9 9 bis 10 Sample number LP+RG 4000 m 2500 m 4500 m 3500 m 2000 m 3000 m Rocks AnCM AN Forest Shrubs LP AnCM Pasture Crops CM SE FL NE Supplementary Image 1: Graphical representation of Concentration of PCBs, OM and vegetation cover along our transect


More Related