Download
1 / 26
260 likes | 395 Views
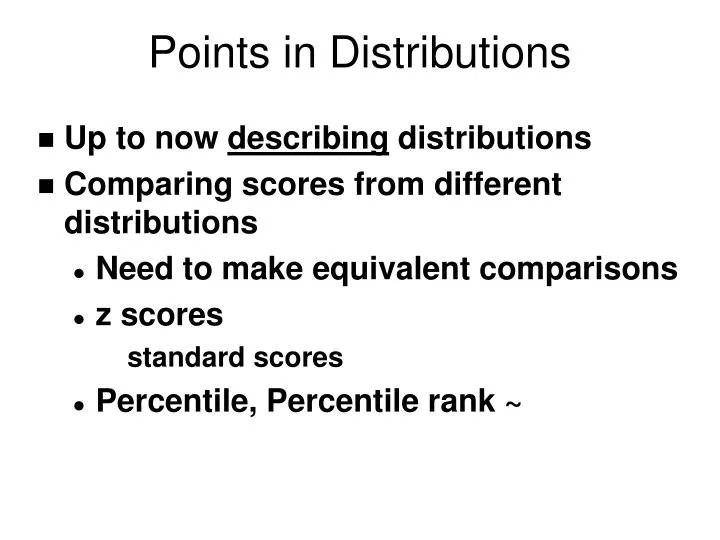
Points in Distributions. Up to now describing distributions Comparing scores from different distributions Need to make equivalent comparisons z scores standard scores Percentile, Percentile rank ~. Standard Scores. Convert raw scores to z scores

E N D
Points in Distributions • Up to now describing distributions • Comparing scores from different distributions • Need to make equivalent comparisons • z scores • standard scores • Percentile, Percentile rank ~
Standard Scores • Convert raw scores to z scores • raw score: value using original scale of measurement • z scores: # of standard deviations score is from mean • e.g., z = 2 = 2 std. deviations from mean • z = 0 = mean ~
s z Score Equation X - m z =
Areas Under Distributions • Area = frequency • Relative area • total area = 1.0 = proportion of individual values in area under curve • Relative area is independent of shape of distribution ~
0.5 0.5 10 20 30 40 50 60 70 80 90 Total area under curve = 1.0
Using Areas Under Distributions • Given relative frequency, what is value? • e.g., the hottest 10% of days the temperature is above ____? • find value of X at border ~
Areas Under Normal Curves • Many variables » normal distribution • Normal distribution completely specified by 2 numbers • mean & standard deviation • Many other normal distributions • have different m & s ~
Areas Under Normal Curves • Unit Normal Distribution • based on z scores m = 0 s = 1 • e.g., z = -2 • relative areas under normal distribution always the same • precise areas from Table B.1 ~
.34 .02 .02 .14 -2 -1 0 +1 +2 Areas Under Normal Curves f .34 .14 standard deviations
Calculating Areas from Tables • Table B.1 (in our text) • The Unit Normal Table • Proportions of areas under the normal curve • 3 columns • (A) z • (B) Proportion in the body • (C) Proportion in the tail • Negative z: area same as positive ~
f -2 -1 0 +1 +2 z Calculating Areas from Tables • Finding proportions • z < 1 = (from B) • z > 1: (from C) ~
f -2 -1 0 +1 +2 z Calculating Areas from Tables • Area: 1 < z < 2 • find proportion for z = 2; • subtract proportion for z = 1 ~
Other Standardized Distributions • Normal distributions, • but not unit normal distribution • Standardized variables • normally distributed • specify m and sinadvance • e.g., IQ test • m = 100; s = 15 ~
-2 85 -1 100 0 115 +1 130 +2 70 z scores Other Standardized Distributions m = 100 s= 15 f IQ Scores
X - m s z = Transforming to & from z scores • From z score to standardized score in population X = zs + m • Standardized score ---> z score
Normal Distributions: Percentiles/Percentile Rank • Unit normal distributions • 50th percentile = 0 = m • z = 1 is 84th percentile • 50% + 34% • Relationships • z score & standard score linear • z score & percentile rank nonlinear ~
Percentiles & Percentile Rank • Percentile • score below which a specified percentage of scores in the distribution fall • start with percentage ---> score • Percentile rank • Per cent of scores £ a given score • start with score ---> percentage • Score: a value of any variable ~
Percentiles A 58 56 54 54 52 50 48 46 44 42 B 50 46 32 30 30 23 23 22 21 20 • E.g., test scores • 30th percentile = (A) 46; (B) 22 • 90th percentile = (A) 56; (B) 46 ~
Percentile Rank A 58 56 54 54 52 50 48 46 44 42 B 50 46 32 30 30 23 23 22 21 20 • e.g., Percentile rank for score of 46 • (A) 30%; (B) = 90% • Problem: equal differences in % DO NOT reflect equal distance between values ~
.34 .34 .02 .02 .14 .14 -2 85 -1 100 0 115 +1 130 +2 70 z scores IQ Scores f IQ percentile rank 2d 16th 50th 84th 98th
Determining Probabilities • Must count ALL possible outcomes • e.g. of flipping 2 coins outcomes 1 2 3 4 coin A: head tail tail head coin B: head tail head tail
Determining Probabilities • Single fair die • P(1) = P(2) = … = P(6) • Addition rule • keyword: OR • P(1 or 3) = • Multiplication rule • keyword AND • P(1 on first roll and 3 on second roll) = • dependent events ~
Conditional Probabilities • Put restrictions on range of possible outcomes • P(heart) given that card is Red • P(Heart | red card) = • P(5 on 2d roll | 5 on 1st roll)? • P = • 1st & 2d roll independent events ~
Table: column B or C X = z s + m area under distribution Raw Score (X) z score X - m s z = Table: z - column A Know/want Diagram
Percentage raw score • Percentile rank percentile • Or probability raw score • What is the 43d percentile of IQ scores? • 1. Find area in z table • 2. Get z score • 3. X = zs + m