Download
1 / 24
240 likes | 336 Views
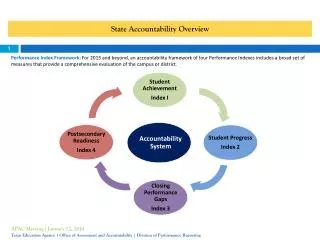
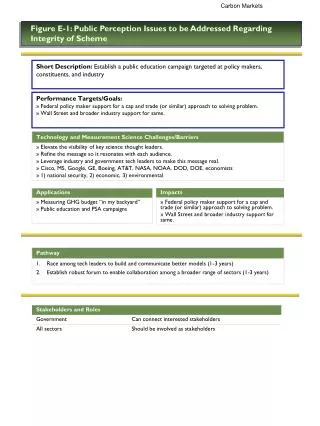
2015 Goals and Targets for State Accountability. Date: 10/01/2014 Presenter: Carla Stevens Assistant Superintendent, Research and Accountability. Performance Index Framework Overview. CHANGES FOR 2014-2015 and BEYOND. Accountability System. Phase-in Standards on STAAR

E N D
2015 Goals and Targets for State Accountability Date: 10/01/2014 Presenter:Carla Stevens Assistant Superintendent, Research and Accountability
CHANGES FOR 2014-2015 and BEYOND • Accountability System • Phase-in Standards on STAAR • The state revised the phase-in standards on the STAAR from 2 steps to 3. • Phase-in 1 will remain in effect through the 2014-2015 school year. • Phase-in 2 will be the standard for 2015-2016 through 2017-2018. • Phase-in 3 (NEW) will be the standard for 2018-2019 through 2020-2021. • The final recommended Satisfactory standards will go into effect in 2021-2022. • The new cut scores are posted on the State’s website.
CHANGES FOR 2014-2015 and BEYOND • Accountability System • Math Standards on STAAR • The revised TEKS for K-8 math will be implemented in 2014-2015. • New performance standards for STAAR grades 3-8 will be set in summer 2015. • Raw scores will be available in the spring. New reports and data files with standards will be available in August 2015. • For accountability purposes, TEA will determine equivalent performance standards on the 2015 assessments to the 2014 assessments. The 2015 state and federal accountability results will be based on student performance on the 2015 math assessments at the “equivalent passing standard.”
CHANGES FOR 2014-2015 and BEYOND • Accountability System • Progress Measures for Index 2 • Students will not receive a STAAR progress measure for mathematics in grades 4-8. • A STAAR progress measure will be reported for the first time for grade 7 writing. • A STAAR progress measure will be reported for eligible STAAR A students who took STAAR or STAAR L in 2013-2014. • Students will not receive a STAAR Alternate 2 progress measure.
CHANGES FOR 2014-2015 and BEYOND • Accountability System • What we don’t know • New Targets for each index for 2015. • Any additional changes that may come into effect this year!
TARGET SETTING FOR 2014-2015 • Accountability System • Goals and Projected Targets • The Red is equal to the current score, or 95, if current score is higher than 95, and is considered no growth. • The Greenis the index goal score which is subtracting the current score from the max score (100) and then multiplied by the growth factor (.1) and finally added back to the current score. The minimum index goal score is equal to Projected Target, and the maximum is 100. • The Yellow range represents growth which is higher than the current score but less than the index goal score.
METRICS • Student Achievement • Index I • All Students Only • Combined over All Subject Areas and all STAAR test versions • Credit given for Level II Satisfactory Performance at the phase-in 1 standard
SCORING TABLE • Student Achievement • Index I
TARGET SETTING • Student Achievement • Index I • ASSUMPTION that the State will increase target to 60. Example: Max score (100) – current score (41) = 59 x 0.1 = 5.9 + 41 = 47, but 47<60 therefore 60.
METRICS Ten Student Groups Evaluated: All Students Race/Ethnicity: African American, American Indian, Asian, Hispanic, Pacific Islander, White Two or More Races Students with Disabilities English Language Learners (ELLs) By Subject Area (Readingand MathWriting) Same assessments used in Index 1 where student progress measures are available Credit based on weighted performance: 1 point for each percent of students who meet growth expectations, 2 points for each percent of students who exceed growth expectations • Student Progress • Index 2
SCORING TABLE • Student Progress • Index 2
SCORING TABLE • Student Progress • Index 2
TARGET SETTING • ASSUMPTION of a 2 point increase to 35 for ES, 30 MS, 25 HS; actual still based on reading and math • Example: Max score (100) – current score (29) = 71 x 0.1 = 7.1 • + 29 = 36 (>35) • Student Progress • Index 2
METRICS • Closing Performance Gaps • Index 3 • All Economically Disadvantaged Students up to Two Lowest Performing Racial/Ethnic Groups based on the Index 1 student achievement indicator reported in the prior year • By Subject Area (Reading/ELA, Mathematics, Writing, Science, and Social Studies) • Same Assessments Used in Index 1 • Credit based on weighted performance: • One point credit given for each percentage of students at the phase-in 1 Level II Satisfactory standard • Two credits given for each percentage of students at the Level III Advanced standard
ScoringTable • Closing Performance Gaps • Index 3
SCORING TABLE • Closing Performance Gaps • Index 3
TARGET SETTING • ASSUMPTION of a 2-4 point increase to 30 for ES, 30 MS, 35 HS • Example: Max score (100) – current score (28) = 72 x 0.1 = 7.2 • + 28 = 35 (>30) • Closing Performance Gaps • Index 3
METRICS STAAR Percent Met Level II Final Standard on at Least 2 Subjects Assessment results include all assessments evaluated in Index I Eight Student Groups Evaluated: All Students Each Race / Ethnicity Four-year Graduation Rate or Five-year Graduation Rate (or Annual Dropout Rate if no graduation rate) Ten Student Groups Evaluated; All Students, each Race/Ethnicity, Students with Disabilities, and ELLs Percent Recommended or Advanced High School Program Plan (RHSP/AHSP) Graduates Eight Student Groups Evaluated: All Students and each Race/Ethnicity Percent of Graduates the met College Ready Criterion on Reading and Math Eight Student Groups Evaluated: All Students and each Race/Ethnicity • Postsecondary Readiness • Index 4
High Schools with Graduation Rates • Postsecondary Readiness • Index 4
SCORING TABLE • Postsecondary Readiness • Index 4
TARGET SETTING • ASSUMPTION of a 2-4 point increase to 15 for ES, 15 MS, 25 HS; STAAR targets only, • Example: Max score (100) – current score (7) = 93 x 0.1 = 9.3 • + 7 = 16 (>15) • Postsecondary Readiness • Index 4
Safeguard Measures and Targets • Accountability System Source: TEA waiver application
Thank you Date: 10/01/2014 Presenter:Carla Stevens Assistant Superintendent, Research and Accountability